Profiling Azure Functions JavaScript code during local development
Azure Application Insights provides some excellent profiling functionality when targeting .NET and running your production workloads in Azure. As far as I'm aware Azure Application Insights does not currently provide support for profiling NodeJS workloads in an equivalent manner.


Azure Application Insights provides some excellent profiling functionality when targeting .NET and running your production workloads in Azure. As far as I'm aware Azure Application Insights does not currently provide support for profiling NodeJS workloads in an equivalent manner.
When it comes to local development, we need to rely on the functionality provided by our dev tooling and frameworks. There are multiple options for profiling NodeJS applications; NodeJS is a runtime which is built on top of the Google V8 JavaScript Engine. Fortunately, the Google V8 JavaScript Engine comes with its own built-in profiler, and this means that NodeJS includes a profiler out of the box.
Visual Studio Enterprise has excellent built-in Profiling capabilities for various application runtimes (Including NodeJS) and provides an excellent experience for developing & debugging these applications. Visual Studio Code is another excellent Editor with less features in the box but has a great extensibility model with many first- and third-party extensions already published to the Visual Studio Marketplace.
In this post I would like to explore how we can leverage the built-in profiler as part of our local development process to identify performance issues within our Azure Functions JavaScript codebase.
Requirements:
- Node.js 12.x or select another version which is supported for use with Azure Functions.
- Azure Functions CLI.
- Azure CLI.
- Visual Studio Enterprise or Visual Studio Code.
Azure Functions CLI
Follow the steps below or this guide to create a simple JavaScript Azure Function which we will use to demonstrate the profiler functionality.
- Initialize a new Azure Function Project,
PS:/> func init LocalFunctionProj --javascript
Writing package.json
Writing .gitignore
Writing host.json
Writing local.settings.json
Writing C:\temp\LocalFunctionProj\.vscode\extensions.json
2. Create a simple HTTP Trigger function
PS:/> func new --name MySlowFunc --template "HTTP trigger" --authlevel "anonymous"
Use the up/down arrow keys to select a template:HTTP trigger
Function name: [HttpTrigger] Writing C:\temp\LocalFunctionProj\MySlowFunc\index.js
Writing C:\temp\LocalFunctionProj\MySlowFunc\function.json
The function "MySlowFunc" was created successfully from the "HTTP trigger" template.
3. Introduce some slow performing code by replacing the contents of MySlowFunc\index.js with the following:
module.exports = async function (context, req) {
    context.log('JavaScript HTTP trigger function processed a request.');

    const name = (req.query.name || (req.body && req.body.name));

    mySlowFunction(10); // higher number => more iterations => slower

    const responseMessage = name
        ? "Hello, " + name + ". This HTTP triggered function executed successfully."
        : "This HTTP triggered function executed successfully. Pass a name in the query string or in the request body for a personalized response.";

    context.res = {
        // status: 200, /* Defaults to 200 */
        body: responseMessage
    };
}

// https://gist.github.com/sqren/5083d73f184acae0c5b7
function mySlowFunction(baseNumber) {
    console.time('mySlowFunction');
    let result = 0;
    for (var i = Math.pow(baseNumber, 7); i >= 0; i--) {
        result += Math.atan(i) * Math.tan(i);
    };
    console.timeEnd('mySlowFunction');
}
4. Make sure the function boots.
PS:/> func start

Azure Functions Core Tools
Core Tools Version:       3.0.2996 Commit hash: c54cdc36323e9543ba11fb61dd107616e9022bba
Function Runtime Version: 3.0.14916.0


Functions:

        MySlowFunc: [GET,POST] http://localhost:7071/api/MySlowFunc

For detailed output, run func with --verbose flag.
[2020-11-27T11:24:21.027Z] Worker process started and initialized.
5. Navigate to the function URL i.e. "http://localhost:7071/api/MySlowFunc?name=Gareth" in the browser, you should notice that it takes a little while to provide a response.
Bootstrapping the V8 Profiler
To bootstrap the V8 profiler we need to execute the Azure Functions node process with the "--prof" argument (Combine with "--nolazy" to disable lazy compilation of your JavaScript code), there are multiple ways we could achieve this:
- Directly from the Azure Function CLI, this can be done ad-hoc as needed with the following command.
PS:/> func start --verbose --language-worker -- "--prof"
2. Via the Language Worker Node Arguments property in your local.settings.json file, this would mean the profiler would be loaded every time the function is run locally.
{
  "IsEncrypted": false,
  "Values": {
    "FUNCTIONS_WORKER_RUNTIME": "node",
    "AzureWebJobsStorage": "",
    "languageWorkers__node__arguments": "--prof"
  }
}
My preference would be to load the profiler as required when we want to perform some profiling, we could further simplify this by leveraging NPM run scripts in your package.json.
{
  "name": "MySlowFunc",
  "version": "1.0.0",
  "description": "",

  "scripts": {
    "profiler": "func start --language-worker -- \"--prof\""
  },
  "author": "Gareth Emslie"
}
To run our function, we simply execute the NPM run script.
PS:/> npm run profiler

> MySlowFunc@1.0.0 profiler C:\temp\LocalFunctionProj
> func start --language-worker -- "--prof"


Azure Functions Core Tools
Core Tools Version:       3.0.2996 Commit hash: c54cdc36323e9543ba11fb61dd107616e9022bba
Function Runtime Version: 3.0.14916.0


Functions:

        MySlowFunc: [GET,POST] http://localhost:7071/api/MySlowFunc

For detailed output, run func with --verbose flag.
[2020-11-27T11:59:01.045Z] Worker process started and initialized.
Regardless of how you end up bootstrapping the profiler you will end up with the same result:
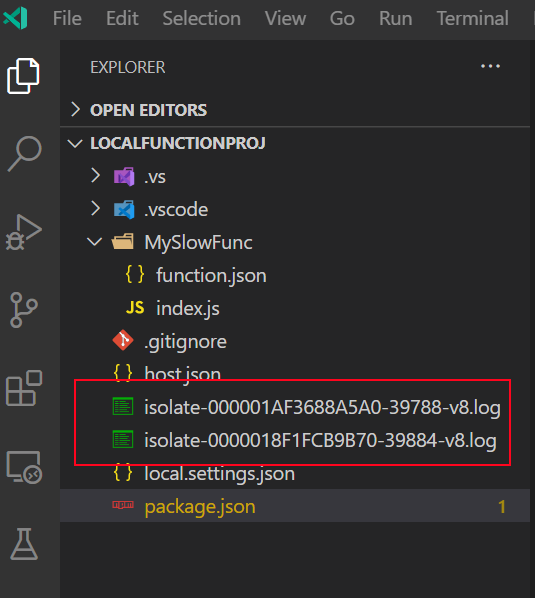
Once we have the profiler tick file, we can process it with the "--prof-process" argument, this will give you a human readable report which you can use to identify any performance issues.
PS:/> node --prof-process isolate-0000018F1FCB9B70-39884-v8.log
Statistical profiling result from isolate-0000018F1FCB9B70-39884-v8.log, (243331 ticks, 18 unaccounted, 0 excluded).

 [Shared libraries]:
   ticks  total  nonlib   name
  238307   97.9%          C:\WINDOWS\SYSTEM32\ntdll.dll
   4914    2.0%          C:\Program Files\nodejs\node.exe
      3    0.0%          C:\WINDOWS\System32\KERNELBASE.dll
      1    0.0%          C:\WINDOWS\System32\KERNEL32.DLL

 [JavaScript]:
   ticks  total  nonlib   name
     88    0.0%   83.0%  LazyCompile: *mySlowFunction C:\temp\LocalFunctionProj\MySlowFunc\index.js:19:24

 [C++]:
   ticks  total  nonlib   name

 [Summary]:
   ticks  total  nonlib   name
     88    0.0%   83.0%  JavaScript
      0    0.0%    0.0%  C++
      3    0.0%    2.8%  GC
  243225  100.0%          Shared libraries
     18    0.0%          Unaccounted

 [C++ entry points]:
   ticks    cpp   total   name

 [Bottom up (heavy) profile]:
  Note: percentage shows a share of a particular caller in the total
  amount of its parent calls.
  Callers occupying less than 1.0% are not shown.

   ticks parent  name
  238307   97.9%  C:\WINDOWS\SYSTEM32\ntdll.dll

   4914    2.0%  C:\Program Files\nodejs\node.exe
   4839   98.5%    LazyCompile: *mySlowFunction C:\temp\LocalFunctionProj\MySlowFunc\index.js:19:24
   4839  100.0%      LazyCompile: ~module.exports C:\temp\LocalFunctionProj\MySlowFunc\index.js:1:33
   4839  100.0%        LazyCompile: ~invocationRequest C:\Program Files\Microsoft\Azure Functions Core Tools\workers\node\worker-bundle.js:18464:22
   4839  100.0%          LazyCompile: ~<anonymous> C:\Program Files\Microsoft\Azure Functions Core Tools\workers\node\worker-bundle.js:18339:32
   4839  100.0%            LazyCompile: ~emit events.js:263:44
I won't go into detail into how to analyze the output above as there are many resources out there like the official V8 Profiler docs which cover this topic.