💡
Attention readers! We want to let you know that the summaries in this newsletter are generated using cutting-edge generative AI technology. However, we understand the importance of accuracy and quality content, so our team of expert editors manually reviews each summary before it's published. If you feel the quality of a particular summary does not meet your expectations, please leave a comment in the Member Discussion section below. We will rectify it as soon as humanly possible!
Azure Monitor Baseline Alerts
This blog post talks about Azure Monitor Baseline Alerts, which helps in setting up a baseline for your application's performance by defining thresholds for different metrics. The post explains how you can create a baseline and configure alerts based on it. It also discusses the benefits of using baseline alerts and how they can help in proactively identifying issues before they become critical.
#Azure #monitoring #alerts #softcorpremium
Introduction to DORA Metrics
This blog post introduces the DORA metrics which are five key metrics that offer a standardized view that the DevOps team can use to measure success. The metrics focus on the measurements of DevOps throughput and reliability together and can let you understand the reliability of your deployments and how quickly you are shipping code to production. Deployment frequency, lead time for changes, change failure rate, time to restore service, and reliability are the five metrics that this blog post explains in detail. It also highlights the benefits and challenges of these metrics and how to apply best practices when working with them.
#DORA #DevOps #metrics #softcorpremium #softcorpremium
Announcing Query plan samples for Cloud Spanner | Google Cloud Blog
Google Cloud has announced Query Plan Samples for Cloud Spanner, a fully managed relational database that offers near unlimited scale, strong consistency, and industry leading high availability. This new feature is a powerful visual tool that lets developers and DBAs visualize query execution plans for historical query executions. It not only lets users quickly visualize the execution plan for samples of the selected query, but it also makes it easy for users to compare and contrast execution plans for instances of the same query.
#CloudSpanner #QueryPlanSamples #softcorpremium
How Logz.io Reduced Internal Logs Volume by 50% Using Data Optimization Hub
Logz.io reduced its internal log volume by 50% through data optimization. Cost optimization is a hot topic in observability, and Logz.io used its own observability tools to monitor the health of dozens of microservices and perform troubleshooting. By focusing on log volume, Logz.io tackled the issue with a step-by-step plan. They started by determining their current situation, then identified where to optimize. The result was a reduction in internal log volume by 50 percent.
#costoptimization #observability #dataoptimization #softcorpremium
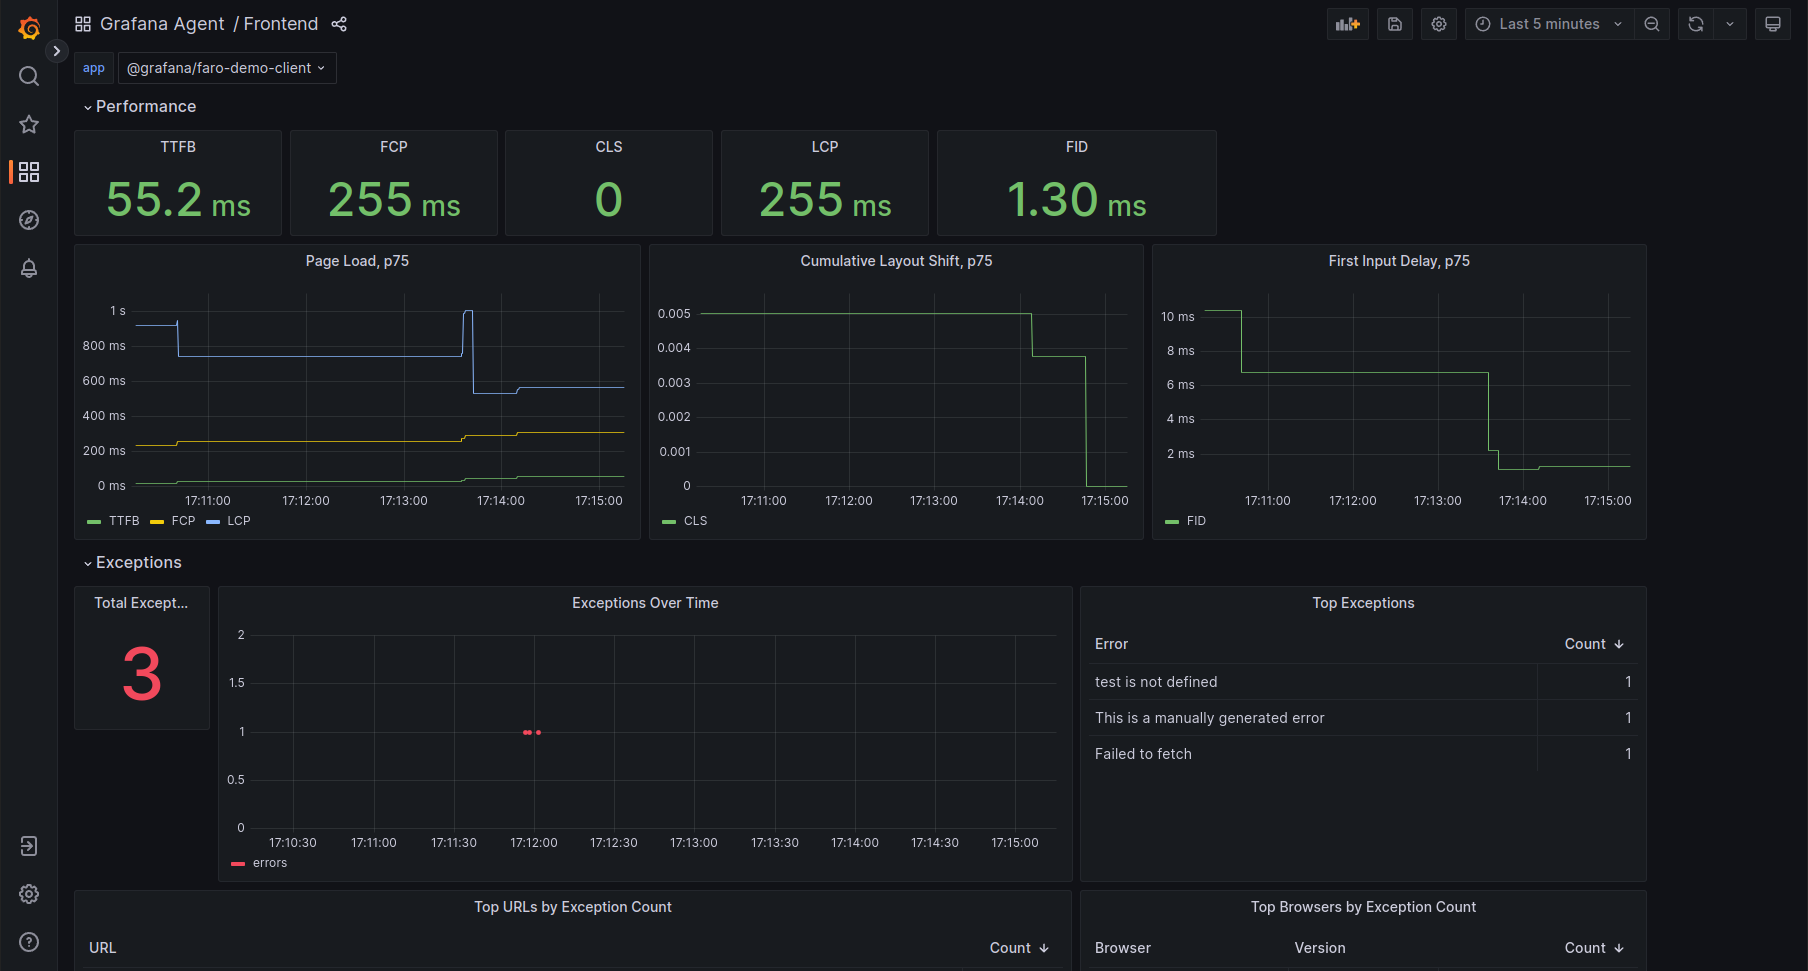
Frontend Observability with Grafana Faro – Mayflower Blog
The blog post talks about how Grafana Faro, a JavaScript library, allows its users to observe the frontend of their web application using the Grafana stack (Tempo, Loki, Grafana) and how it enhances visibility into the inner workings of the code at runtime. It also mentions the integration of Faro with the Agent running in “flow” mode and the forwarding of data to traces and logs instances, Loki and Tempo, respectively. The post also highlights some issues with Faro, Sentry, and New Relic integration.
#GrafanaFaro #FrontendObservability #softcorpremium
Connecting the dots using OpenTelemetry — Part -I | by Mohit Shukla | Engineering at Bureau
OpenTelemetry is a powerful toolset that enables the collection and measurement of telemetry data such as metrics, logs, and traces from software. This post discusses the advantages of using OpenTelemetry, including its vendor-agnostic approach, speed, and data governance capabilities. The post also highlights how Bureau uses OpenTelemetry to increase observability by collecting data from all layers of an application stack, including distributed systems, to provide insight into system performance and behavior.
#OpenTelemetry #observability #softcorpremium
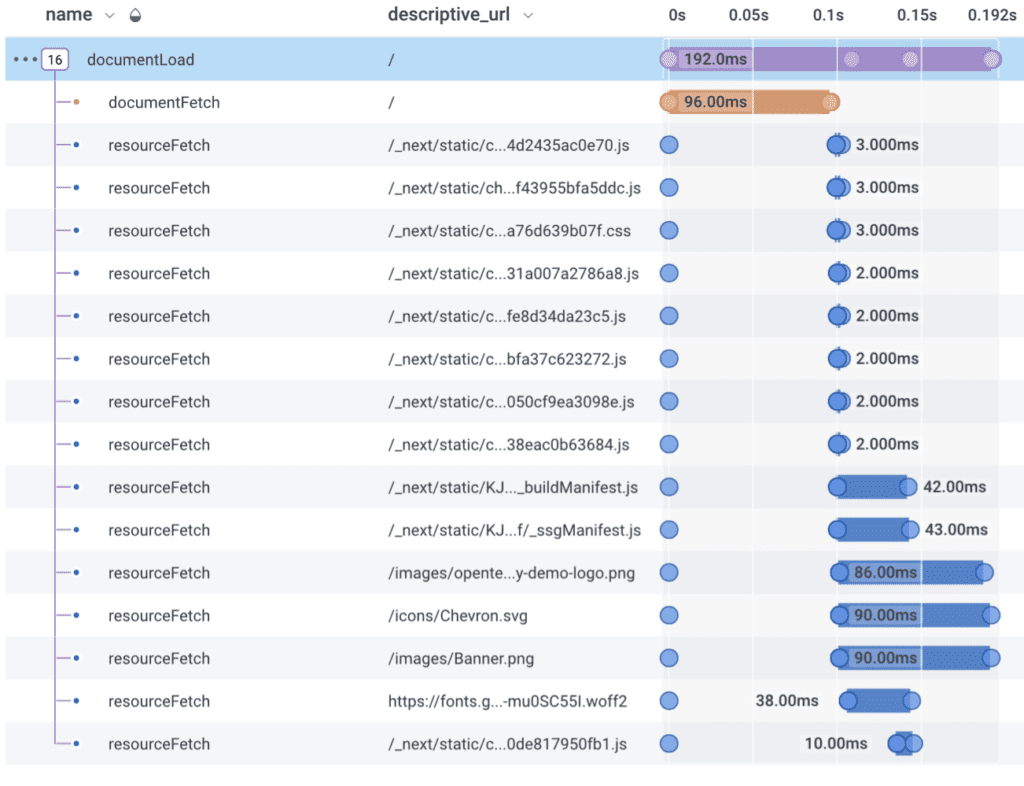
Observable Frontends: the State of OpenTelemetry in the Browser
The blog post discusses the state of OpenTelemetry support for React web clients, focusing on the frontend and how distributed traces with OpenTelemetry can work just as well in the frontend as they do in the backend. It also highlights the complexities of frontend development and how the modern standard of distributed traces is useful for the backend but can also be implemented in the frontend.
#OpenTelemetry #observability #frontend #softcorpremium
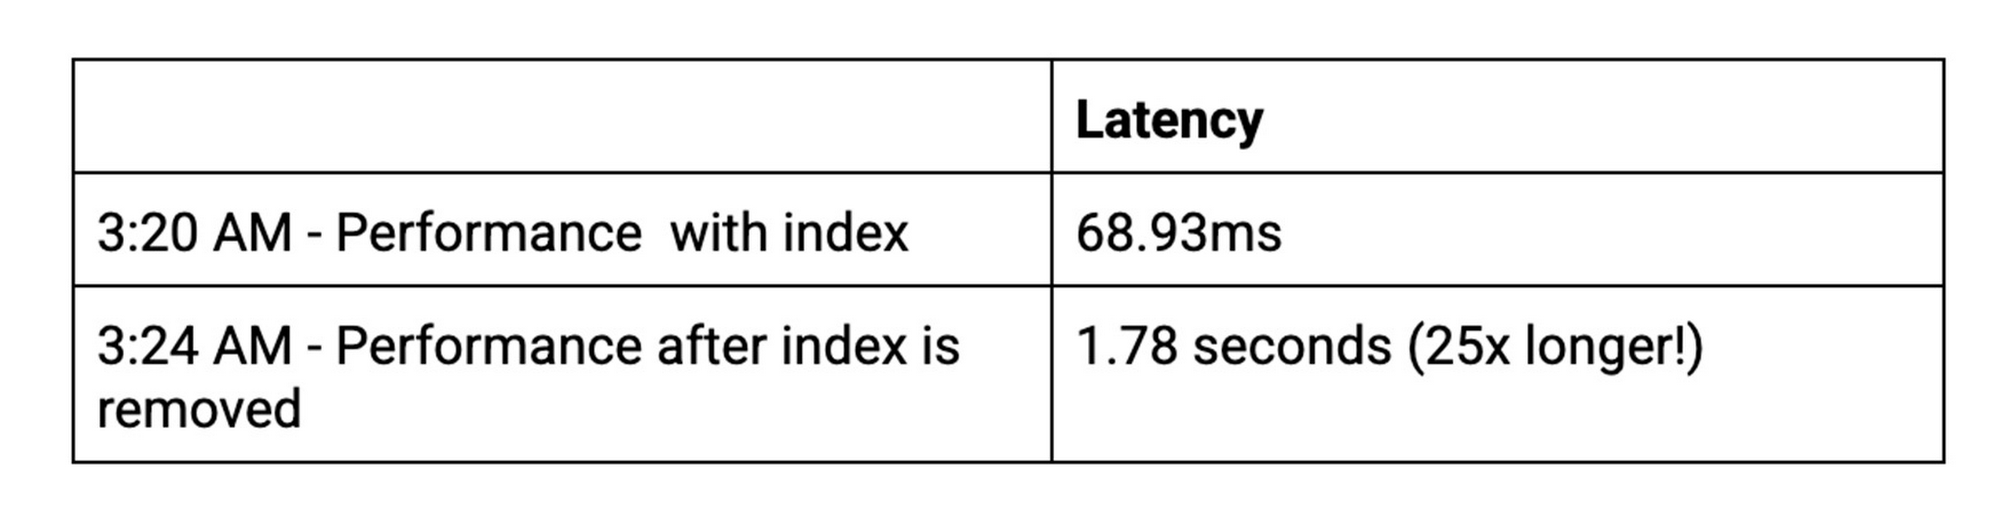
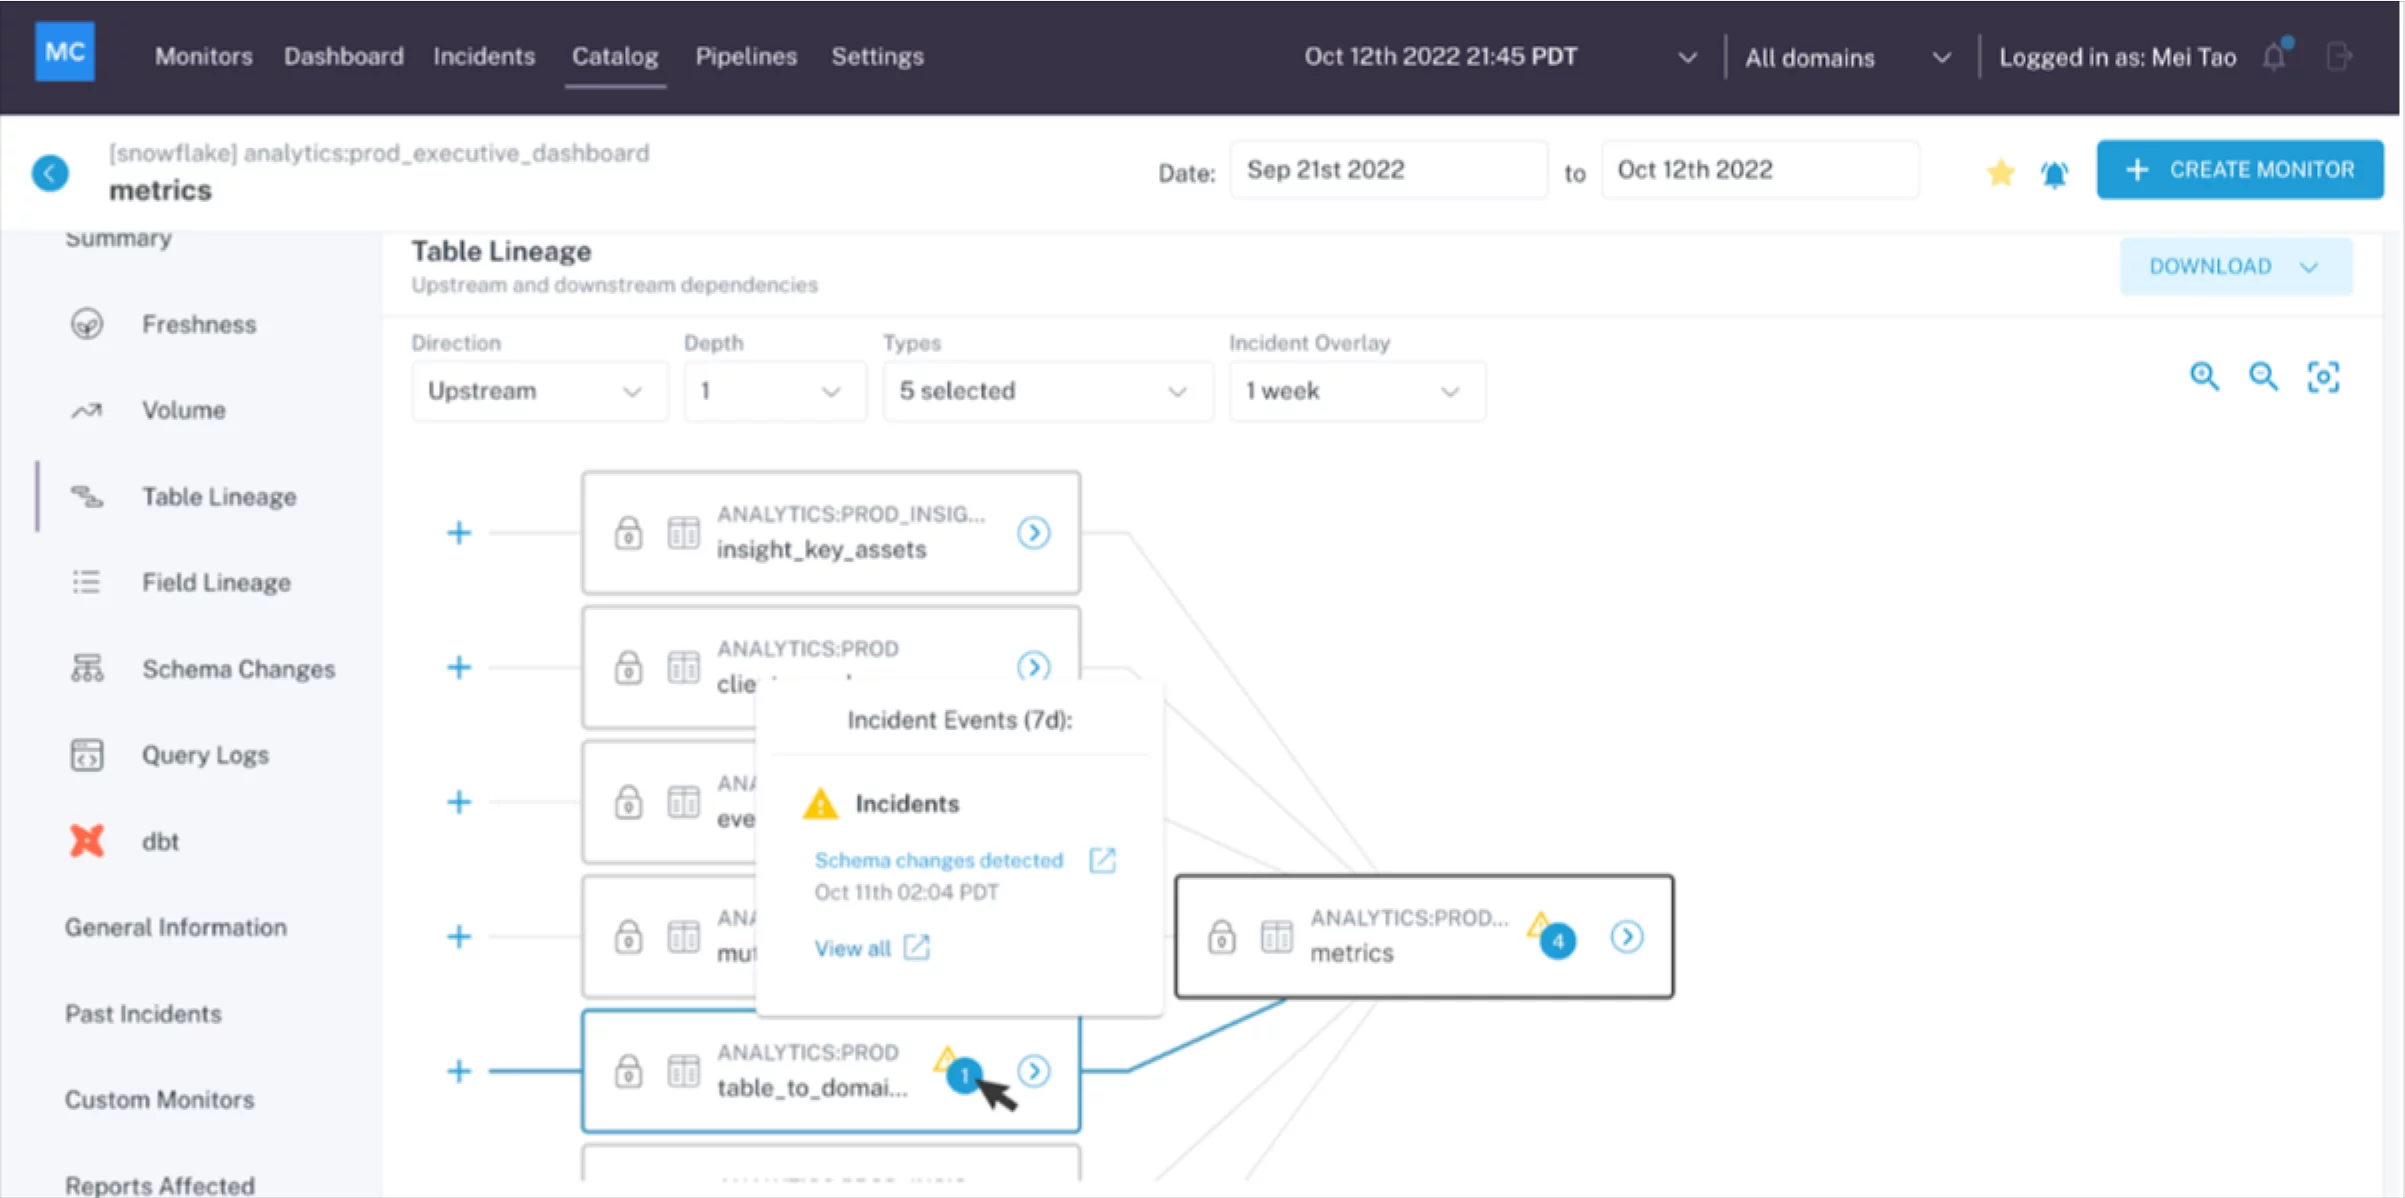
The Annual State Of Data Quality Survey, 2023
The blog post discusses the Annual State of Data Quality Survey in 2023. It talks about the importance of data observability, data platforms, and data culture in ensuring high-quality data. The post also includes case studies and announcements related to data quality.
#DataQuality #DataObservability #DataPlatforms #softcorpremium
What is IT operations analytics? | Dynatrace news
This blog post discusses IT Operations Analytics (ITOA) and its importance in the cloud journey of organizations. It covers how ITOA works, why it’s important, tools to consider, and more. ITOA is the process of unifying, storing, and contextually analyzing operational data to understand the health of applications, infrastructure, and environments. With AI capabilities, ITOA supports faster cloud deployment of digital products and services and trusted business insights. AIOps uses these operational insights to automate root-cause analysis at scale, identify and assess network security risks, improve mean time to detection and mean time to recovery in the cloud, and more.
#ITOA #AI #AIOps #softcorpremium #softcorpremium
Amazon CloudWatch Metric Streams adds support for filtering by metric name
Amazon CloudWatch Metric Streams now supports filtering by metric name. This feature allows users to select specific metrics to stream, reducing the amount of data stored and processed. Essential cookies are necessary to provide the site and services, while performance cookies provide anonymous statistics about how customers navigate the site. Functional cookies help provide useful site features, while advertising cookies may be set through the site by us or our advertising partners.
#AmazonCloudWatch #MetricStreams #softcorpremium
Plexporters, Energize: How we monitor Plex with Grafana | Grafana Labs
The Grafana team decided to monitor their Plex Media Servers by finding better ways to understand what content is popular or stale, when popular times for watching are, and if they're getting the best experience without stressing the hardware. After looking at Tautulli, a powerful tool that helps monitor your server and record various statistics, they decided to create their own project called The Plexporters. The Plexporters is similar to Tautulli but for Grafana, allowing them to get metrics into Prometheus and compose dashboards.
#Plex #Grafana #monitoring #softcorpremium
Amazon CloudWatch Synthetics announces new Synthetics NodeJS runtime version 4.0
Amazon CloudWatch Synthetics has announced a new Synthetics NodeJS runtime version 4.0. This runtime version comes with additional features like AWS SDK for JavaScript v3 and Node.js v14. It also offers more support to the latest Node.js packages, including TypeScript, which is now supported natively, and the ability to use Node.js modules that were not previously supported.
#AmazonCloudWatch #Synthetics #NodeJS #softcorpremium
How to Improve Your App Observability (Easily) with Grafana and OpenTelemetry | Bright Inventions
This blog post explains the importance of application observability and how it can be improved easily using Grafana and OpenTelemetry. The post introduces the Pareto Principle and highlights how 80% of outcomes are derived from 20% of causes. The author emphasizes the benefits of observability, including better visibility into application behavior, improved reliability, and faster problem resolution. The post provides a tutorial on setting up basic monitoring for applications using Grafana and OpenTelemetry.
#Grafana #OpenTelemetry #observability #softcorpremium
Simplifying agent management for AppDynamics SaaS and On-Premises - Application Performance Monitoring Blog | AppDynamics
Cisco AppDynamics is introducing a new set of capabilities to simplify agent lifecycle management, enabling users to spend more time supporting and developing applications and less time maintaining software used to monitor those applications. Agent lifecycle automation provides numerous benefits, including rapid time to value, autodiscover and monitor existing applications, and convenient scheduling.
#agentmanagement #AppDynamics #softcorpremium