💡
Attention readers! We want to let you know that the summaries in this newsletter are generated using cutting-edge generative AI technology. However, we understand the importance of accuracy and quality content, so our team of expert editors manually reviews each summary before it's published. If you feel the quality of a particular summary does not meet your expectations, please leave a comment in the Member Discussion section below. We will rectify it as soon as humanly possible!
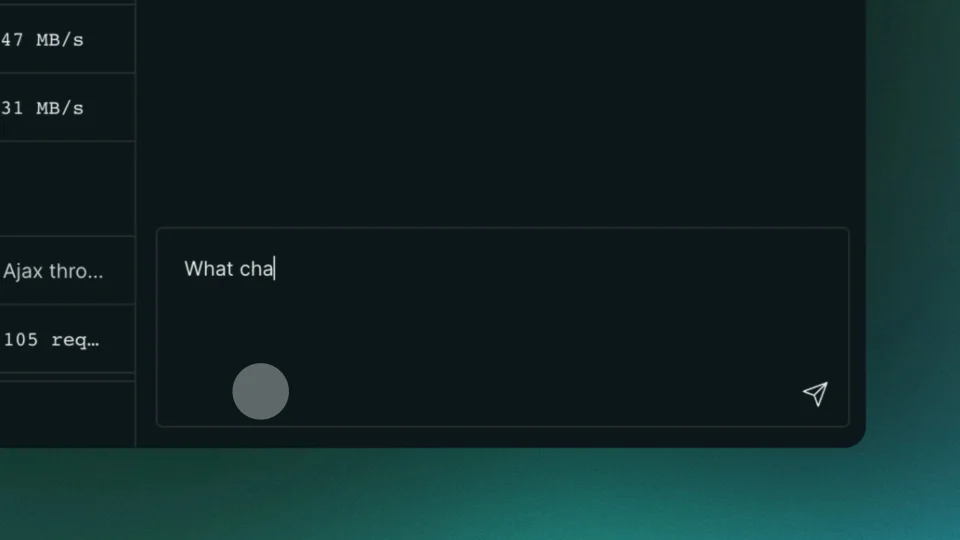
Meet New Relic Grok | New Relic
New Relic introduces the industry's first generative AI assistant, New Relic Grok, which combines OpenAI's large language models and New Relic's unified telemetry data platform to provide deep insights into a system's state simply by asking straightforward questions. The familiar chat interface allows engineers to ask questions and receive in-depth analysis, insights on root causes, and suggested fixes. All engineers can use New Relic Grok to become experts in observability, reduce outages, and increase development velocity and innovation.
#observability #AIassistant #softcorpremium
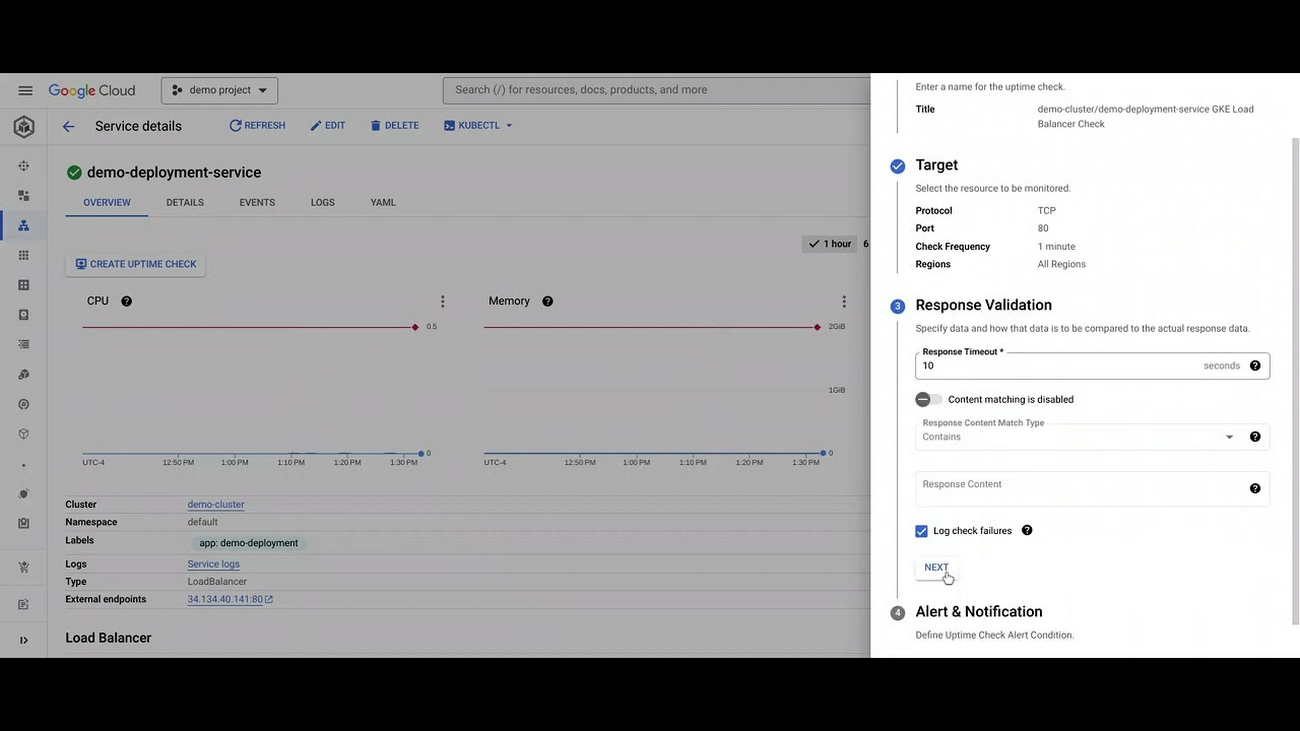
GKE enriches observability in context by adding uptime checks | Google Cloud Blog
Google Cloud has announced the availability of Uptime Checks for Google Kubernetes Engine (GKE) which can proactively detect availability and latency issues with an application and reduce the time and severity your users are impacted by an outage. Uptime checks for GKE services allow you to easily create, manage, and monitor an uptime check for a Kubernetes External LoadBalancer without leaving the GKE UI. It associates a service load balancer directly with an uptime check, ensuring that it is managed dynamically.
#observability #GKE #softcorpremium
Maximizing Kubernetes Efficiency with OpenTelemetry Tracing - The New Stack
The article talks about how OpenTelemetry tracing can help maximize efficiency in Kubernetes. The author explains what OpenTelemetry is and how it can be used for tracing in Kubernetes. They also discuss the benefits of using OpenTelemetry, such as improved observability and troubleshooting. Overall, the article provides valuable insights for those looking to improve their Kubernetes deployment.
#Kubernetes #OpenTelemetry #tracing #softcorpremium
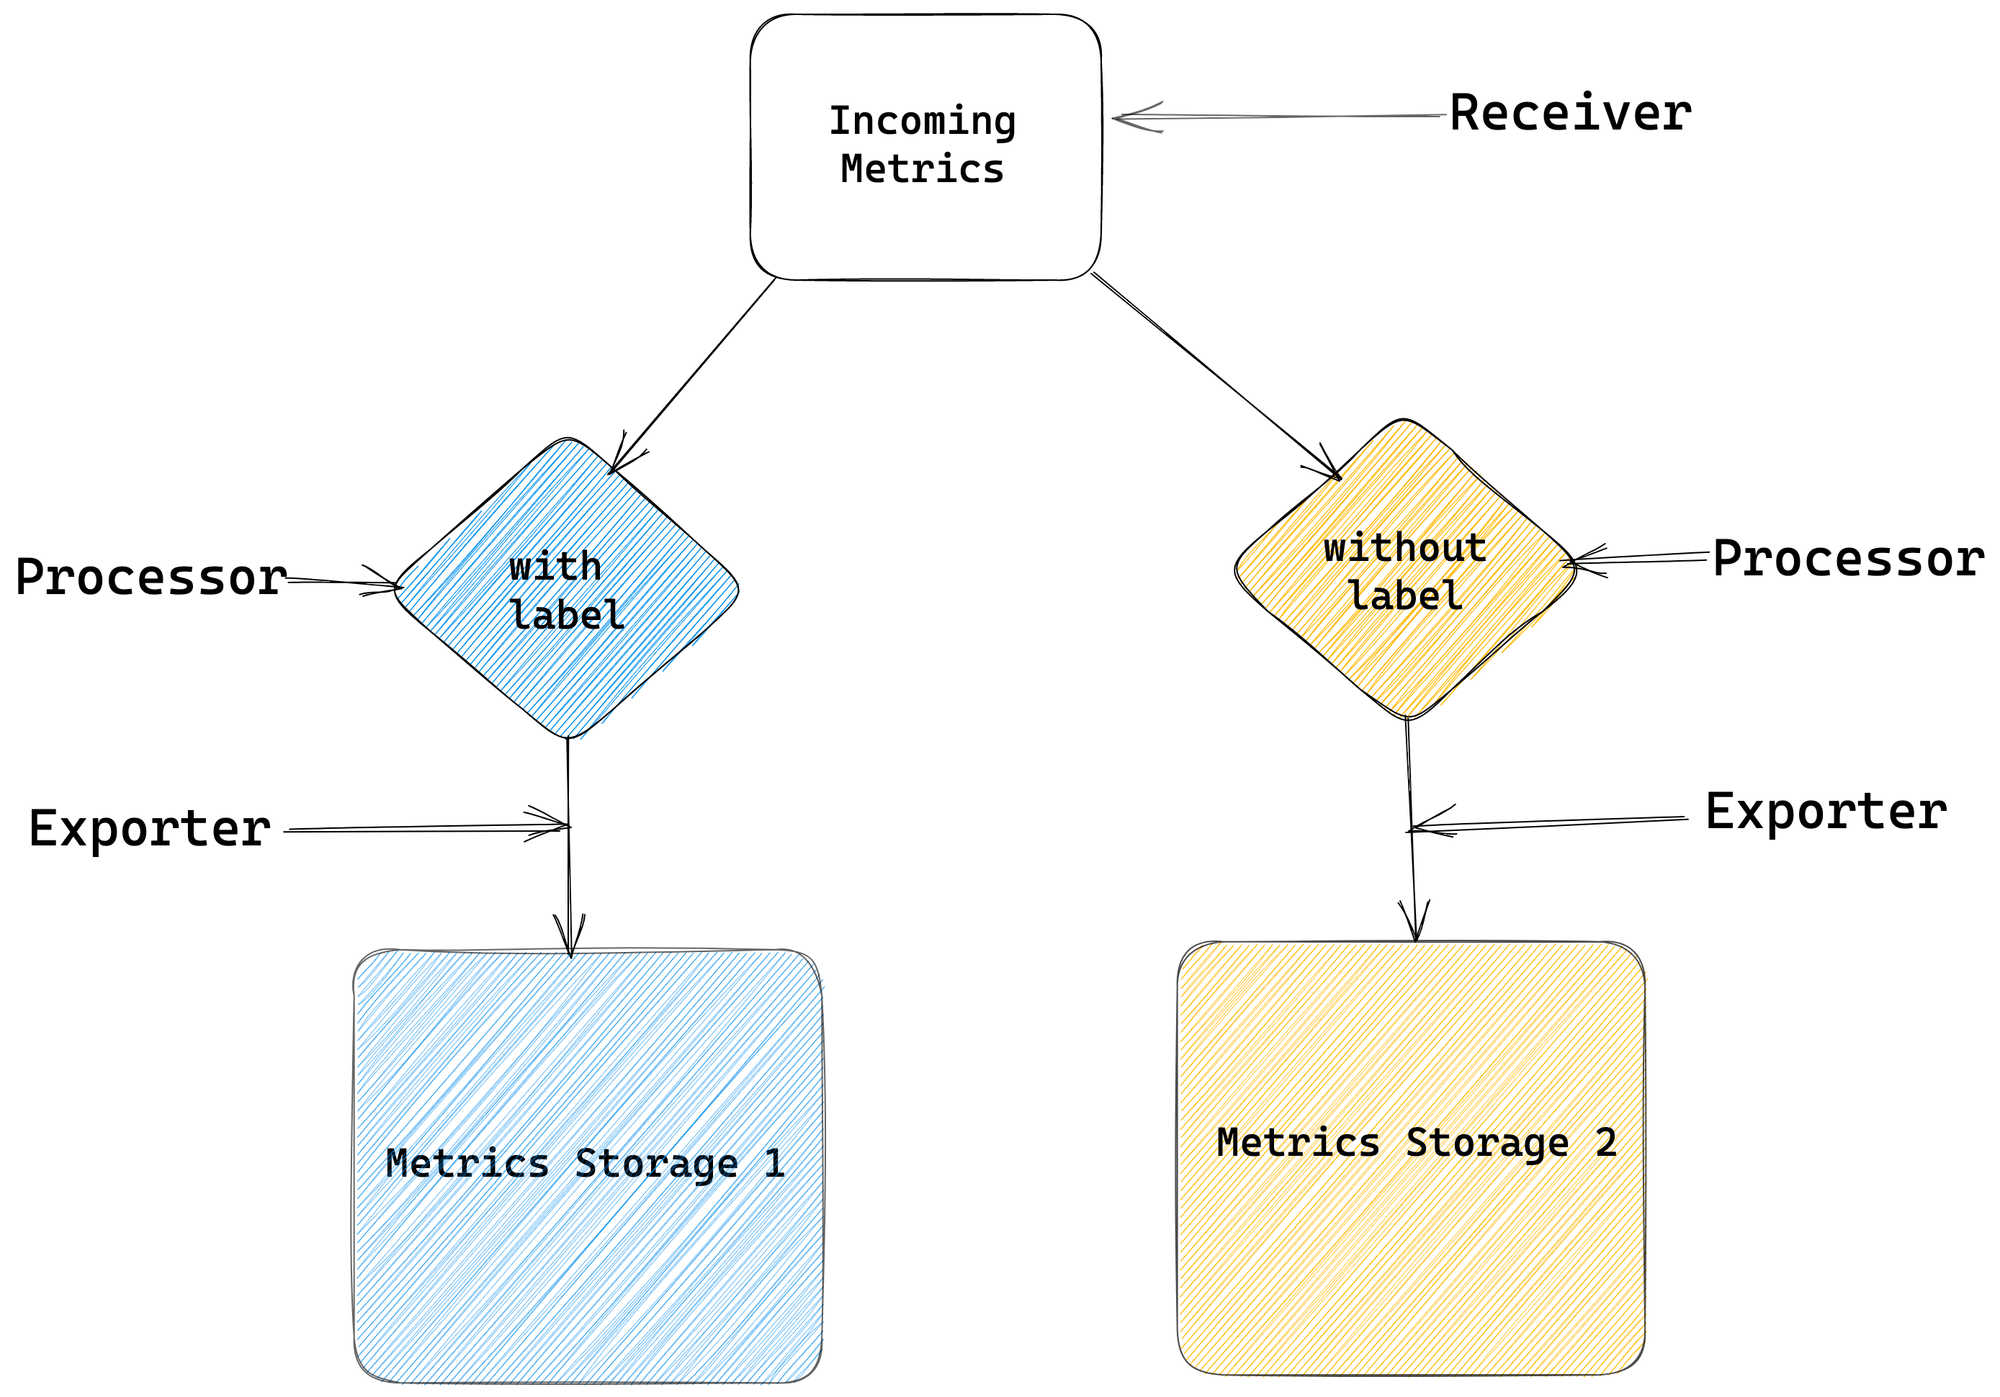
Filtering Metrics by Labels in OpenTelemetry Collector | Last9
The blog post explains how to filter metrics by labels using OpenTelemetry Collector. OpenTelemetry Collector is a vendor-agnostic way to receive, process and export telemetry data. The post focuses on filtering metrics by their labels and then sending them to different destinations. It explains how the OpenTelemetry Collector components are configured to form a pipeline that works end to end.
#OpenTelemetry #metrics #filtering #softcorpremium
61 Data Observability Use Cases That Aren't Totally Made Up
The post highlights the 61 data observability use cases that are not made up and based on Wakefield survey results in the State of Data Quality report for 2023. The post also promotes two eBooks that provide insights into data testing and quality journeys. Overall, the post focuses on the importance of data observability and quality in the data culture, platforms, and reliability with the help of case studies.
#dataobservability #dataquality #softcorpremium
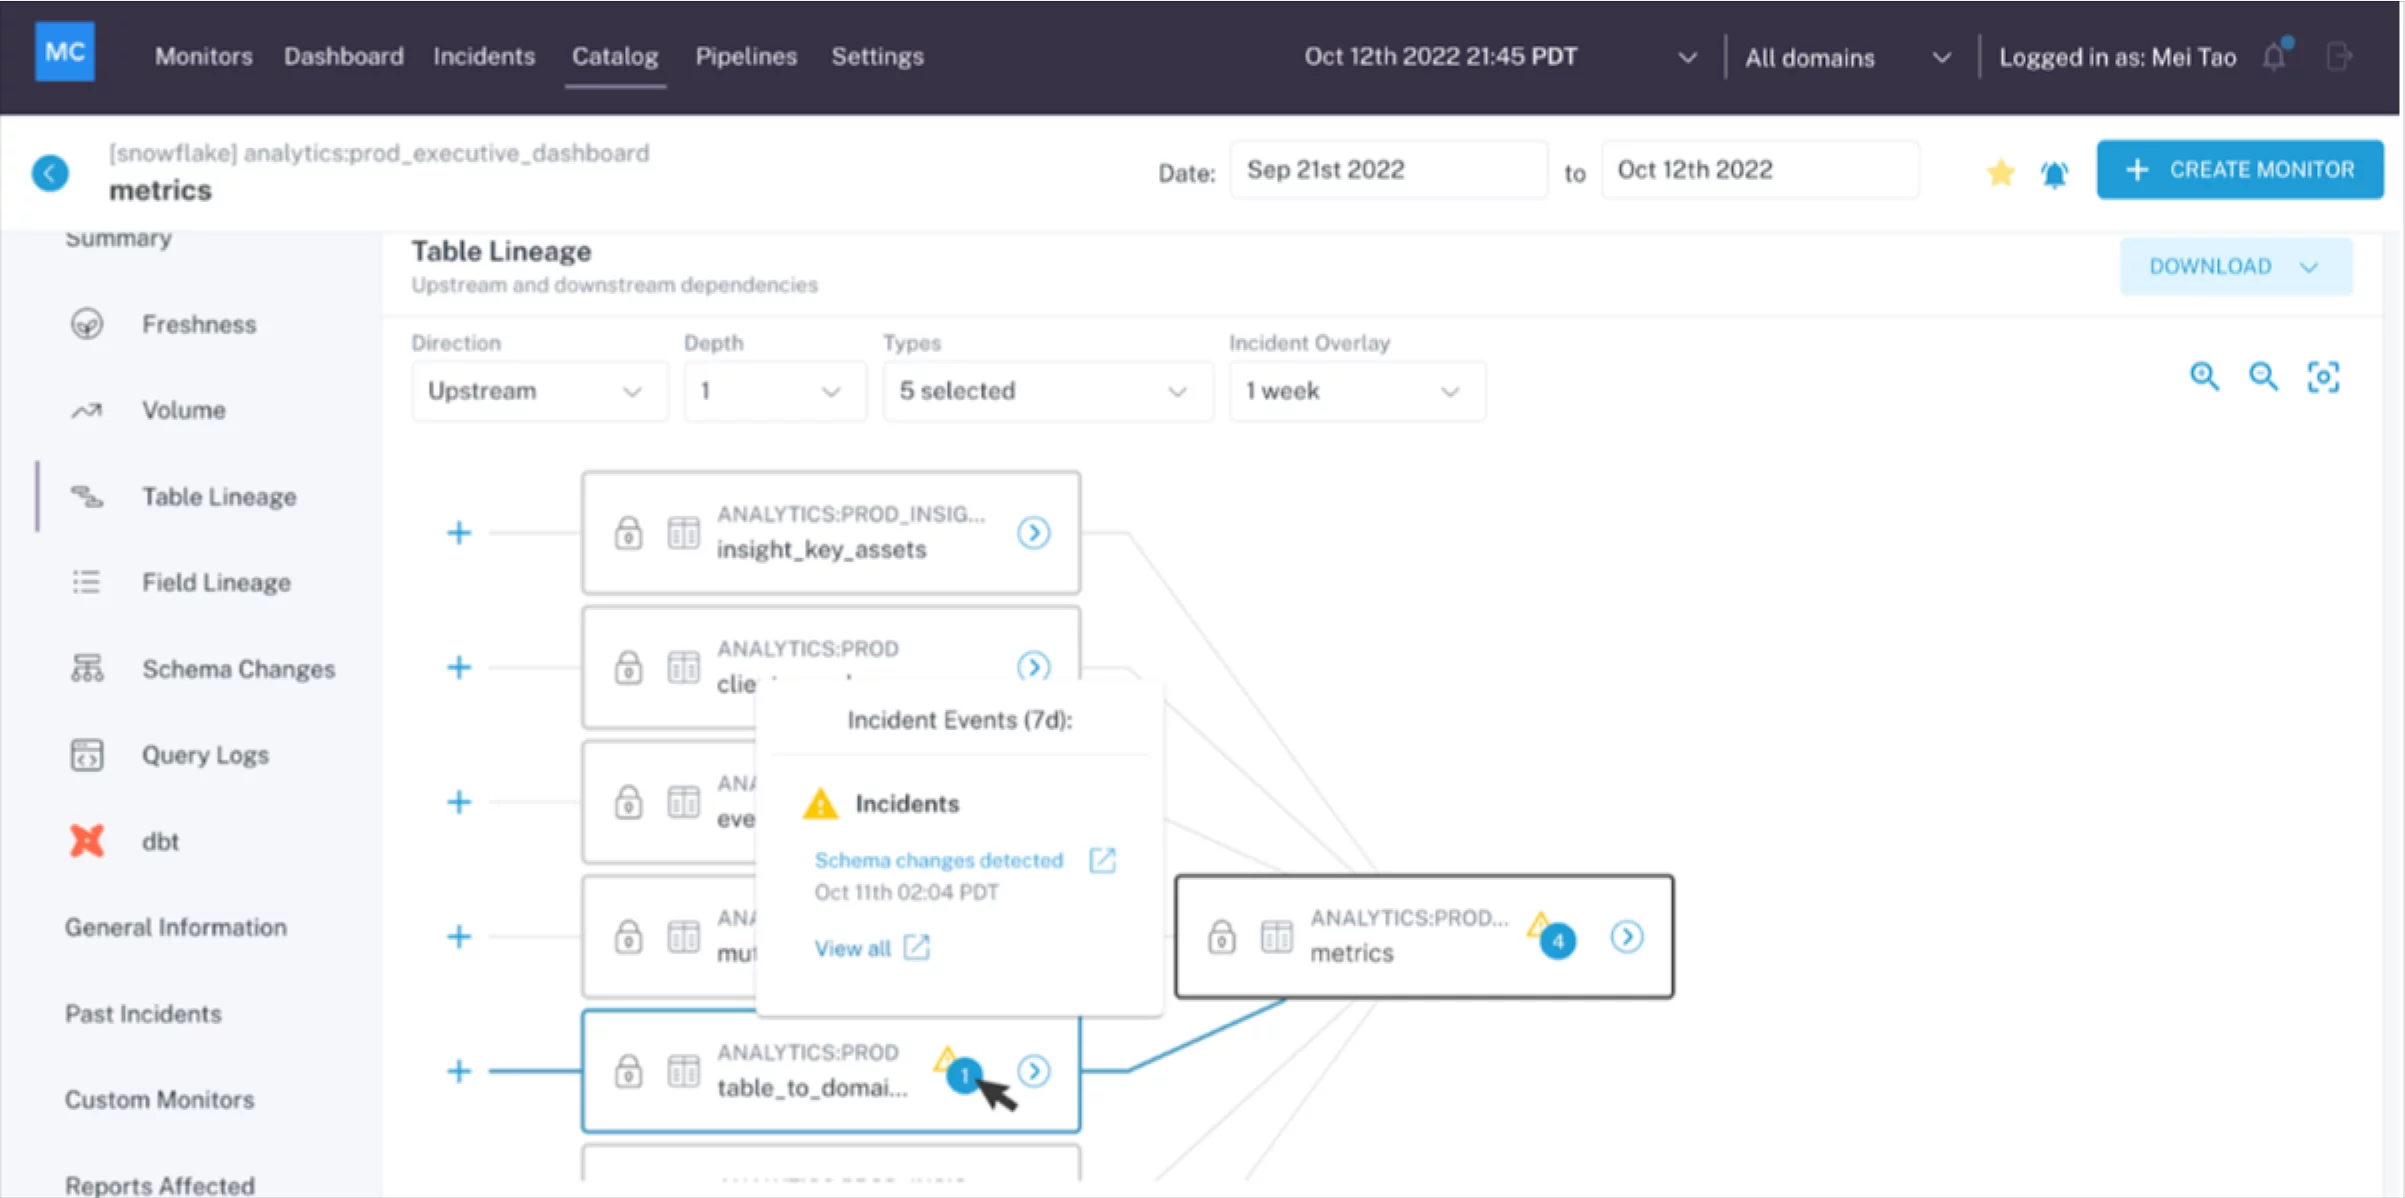
How Monte Carlo’s New GitHub Integration Helps Data Teams Detect, Resolve, And Prevent Breaking Changes Faster
Monte Carlo introduces a new GitHub integration to help data teams detect, resolve, and prevent breaking changes faster. The integration allows users to receive notifications about changes in their data pipelines and datasets, enabling them to quickly identify and resolve issues that may impact their data quality. The integration also provides a way to track changes and collaborate with team members in real-time. This new feature aligns with Monte Carlo's mission to improve data observability for data teams.
#GitHub #dataquality #dataobservability #softcorpremium
How Dynatrace boosts production resilience with Site Reliability Guardian
Dynatrace introduces Site Reliability Guardian to automate software delivery and quality validation tasks, ensuring reliable, secure, and high-quality releases. The tool enables development teams to define quality objectives in their code, which is validated throughout the delivery process before the code reaches production. The Site Reliability Guardian is used in production environments to provide quick insights into the status quo and helps identify areas that need improvement via pre-production validations, following the shift-left approach. Dynatrace uses monitored demo applications to deliver constant load and ensure expected production behavior.
#DevOps #SRE #automation #softcorpremium
Advanced sampling now available in AWS Distro for OpenTelemetry
AWS Distro for OpenTelemetry now offers advanced sampling capabilities, allowing customers to customize their tracing data collection to fit their specific needs. This new feature can help reduce costs and optimize monitoring by collecting only the most relevant data. AWS is continuously improving its observability offerings to help customers better monitor, troubleshoot and optimize their applications and infrastructure.
#AWS #OpenTelemetry #softcorpremium
Collect, instrument, and analyze telemetry data with Dynatrace
Dynatrace OneAgent enables the collection, instrumentation, and analysis of telemetry data beyond application instrumentation, including contextual telemetry data, real user monitoring (RUM), and metrics. OpenTelemetry is the go-to standard for instrumenting custom applications to collect observability telemetry data. With Dynatrace OneAgent, observability telemetry data can be enhanced even more with less effort. This blog post by Alexander Mueller covers the details of how to set up OpenTelemetry in a demo application and how to instrument services.
#observability #OpenTelemetry #OneAgent #softcorpremium
OpenTelemetry configuration and instrumenting applications
This blog post discusses the OpenTelemetry configuration and instrumenting applications using it. The post covers setting up OpenTelemetry in applications and instrumenting services using it. It also includes best practices for defining spans and traces manually. The post focuses on the demo application made up of two parts: a PHP frontend and a JavaScript agent running on Node.js.
#OpenTelemetry #observability #PHP #JavaScript #softcorpremium
OpenTelemetry demo: Identifying metrics and traces
The blog post discusses the importance of observability, particularly in a distributed cloud-based environment, and how OpenTelemetry, an open-source observability tool, can help in instrumenting application telemetry data to make it observable. It includes a demo application that showcases how to identify traces and metrics using OpenTelemetry and connecting to a backend for analysis.
#observability #OpenTelemetry #softcorpremium
Network performance monitoring top of mind for CloudOps teams
Cloud operations teams need end-to-end visibility into multicloud and hybrid cloud environments to fully grasp activities on the network and ensure application and infrastructure performance. 78% of companies plan to increase spending on network visibility tools over the next two years, largely because of the network traffic growth due to the adoption of hybrid and multi-cloud architectures. 99% of organizations have a multicloud environment, and 82% also use hybrid cloud infrastructure. As cloud entities multiply, so do the complex relationships and dependencies among them.
#networkperformance #cloudarchitecture #multi-cloud #softcorpremium