💡
Attention readers! We want to let you know that the summaries in this newsletter are generated using cutting-edge generative AI technology. However, we understand the importance of accuracy and quality content, so our team of expert editors manually reviews each summary before it's published. If you feel the quality of a particular summary does not meet your expectations, please leave a comment in the Member Discussion section below. We will rectify it as soon as humanly possible!
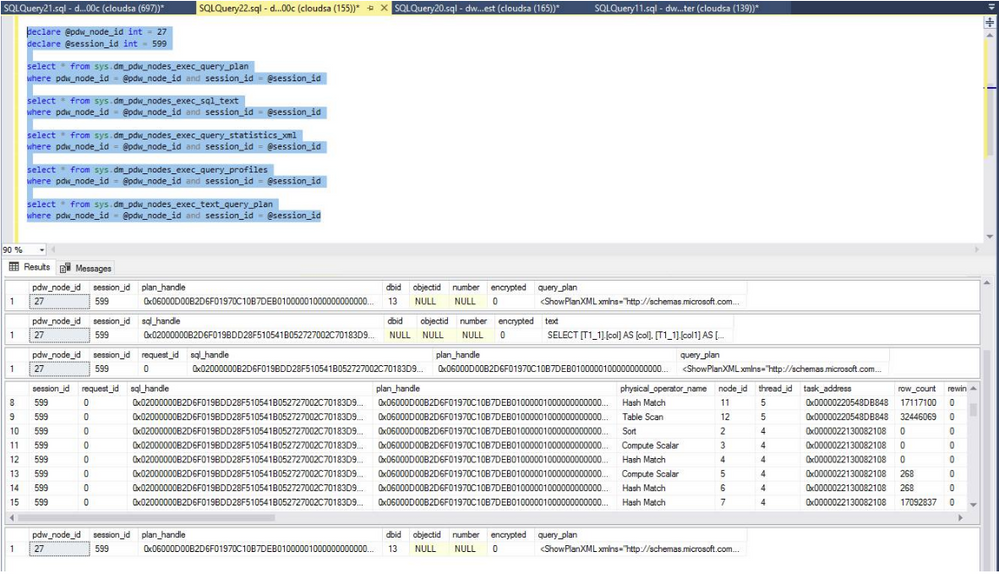
Troubleshooting Query Performance with Synapse's In-Flight Diagnostics - Microsoft Community Hub
This blog post discusses how to troubleshoot query performance with Synapse's In-Flight Diagnostics. It also explains the benefits of using this feature and provides step-by-step instructions on how to use it effectively.
#Synapse #queryperformance #softcorpremium
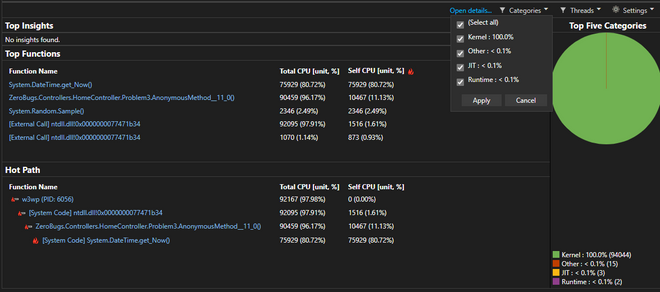
Web App Performance Root Cause Analysis with Application Insights - Microsoft Community Hub
This blog post from Microsoft Community Hub explains how to perform root cause analysis of web application performance using Application Insights. It also provides step-by-step guidance on how to set up Application Insights for a web app, how to analyze the collected data, and how to troubleshoot performance issues. In addition, readers can learn about the different types of telemetry data that Application Insights collects and how to use them to gain insights into the performance of the app.
#ApplicationInsights #performance #softcorpremium
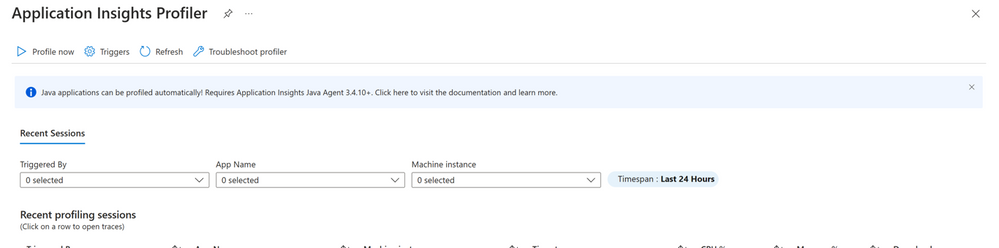
Azure Monitor Application Insights Java Profiler Update
Microsoft has released an update to Azure Monitor Application Insights Java Profiler. The latest update now offers support for the latest OpenJDK 16, and adds support for the latest versions of popular frameworks such as Spring Boot, Micronaut, and Quarkus. Additionally, the update includes performance improvements, bug fixes, and enhancements to the profiler's user interface and experience.
#Azure #JavaProfiler #softcorpremium
Comprehensive Tracing using OpenTelemetry from Beginning to End | by Bijit Ghosh | Apr, 2023 | Medium
OpenTelemetry is an open-source observability framework that provides end-to-end tracing capabilities to help identify the root cause of latency, errors, and performance issues in software systems. It allows you to trace your entire software stack, from client-side applications to microservices, and gather insights into your application performance. OpenTelemetry has set the golden standard in observability by providing a vendor-neutral, open-source solution for collecting, processing, and exporting telemetry data, which is continuously improving with the help of a community of vendors, contributors, and users.
#OpenTelemetry #observability
Making sense of your logs with Log Analytics: A Beginner's Guide - DEV Community
The blog post provides a beginner's guide to Log Analytics, a tool as part of Azure Monitor, which allows administrators and developers to query data stored in Azure Monitor Logs store. It highlights the importance of using Log Analytics to gain insights on Azure resources and how to query data correctly using Kusto Query Language (KQL). The post also walks through the process of creating a workspace using Bicep and sending logs from Azure resources to the workspace.
#Azure #LogAnalytics #softcorpremium
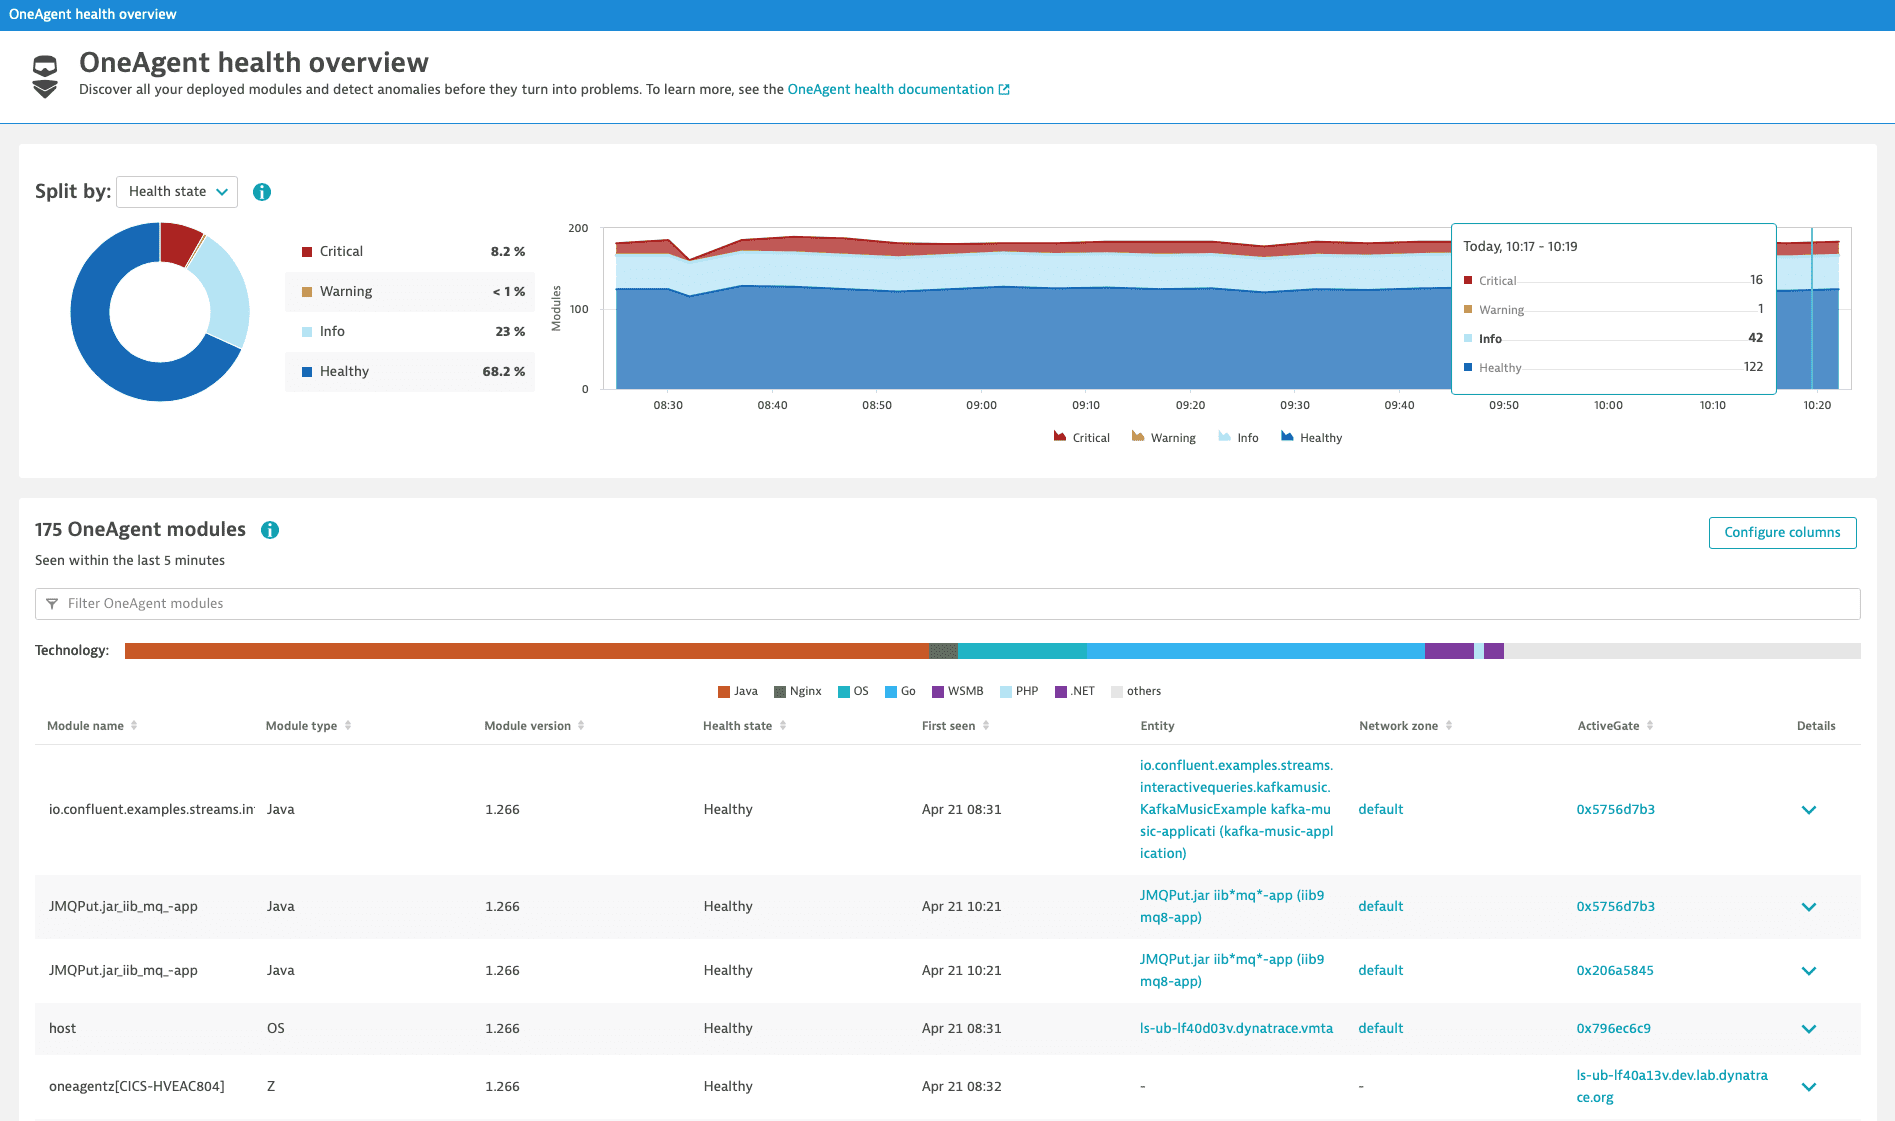
Dynatrace SaaS release notes version 1.265 | Dynatrace Docs
Dynatrace has released version 1.265 of its SaaS offering, with a phased rollout starting on April 25th. The update includes new features such as Grail data lakehouse and Carbon Impact for reducing IT carbon footprint.
#dynatrace #saas #softcorpremium
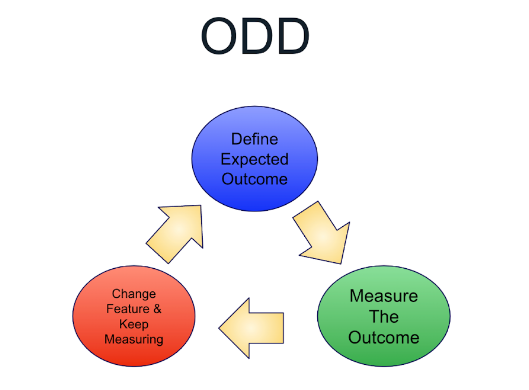
Observability Driven Development (ODD)-Enhancing System Reliability | by Bijit Ghosh | Apr, 2023 | Medium
This blog post provides an overview of observability-driven development (ODD) and its benefits in software development, particularly in cloud-native applications. ODD prioritizes observability to gain insights into the internal workings of a system or application, making it easier to identify and fix issues in real-time. It involves designing systems that are easy to observe, monitor, and troubleshoot by providing relevant data such as logs, metrics, and traces. ODD is an approach to shift left observability to the earliest stage of the software development life cycle and apply it at a component level and as a whole system. The three pillars of observability-driven development are also discussed.
#Observability #ODD #SystemReliability
GitHub - ljacobsson/cw-logs-insights-gpt: Chrome extension that generates CloudWatch Logs Insights queries from ChatGPT prompts
The ljacobsson/cw-logs-insights-gpt is a Chrome extension that generates CloudWatch Logs Insights queries from ChatGPT prompts. The tool helps users to quickly generate complex and accurate search queries for their logs, which can be used in troubleshooting or monitoring activities. It uses the power of GPT (Generative Pre-trained Transformer) language models to understand natural language inputs and convert them into structured log query statements.
#CloudWatch #ChromeExtension #softcorpremium
Data Testing Vs. Data Quality Monitoring Vs. Data Observability: What's Right For Your Team?
This blog post discusses the differences between data testing, data quality monitoring, and data observability, and helps readers determine which approach is best suited for their team. It also highlights the importance of data observability in ensuring data reliability and provides case studies to illustrate its benefits.
#DataTesting #DataQualityMonitoring #DataObservability #DataReliability #CaseStudies
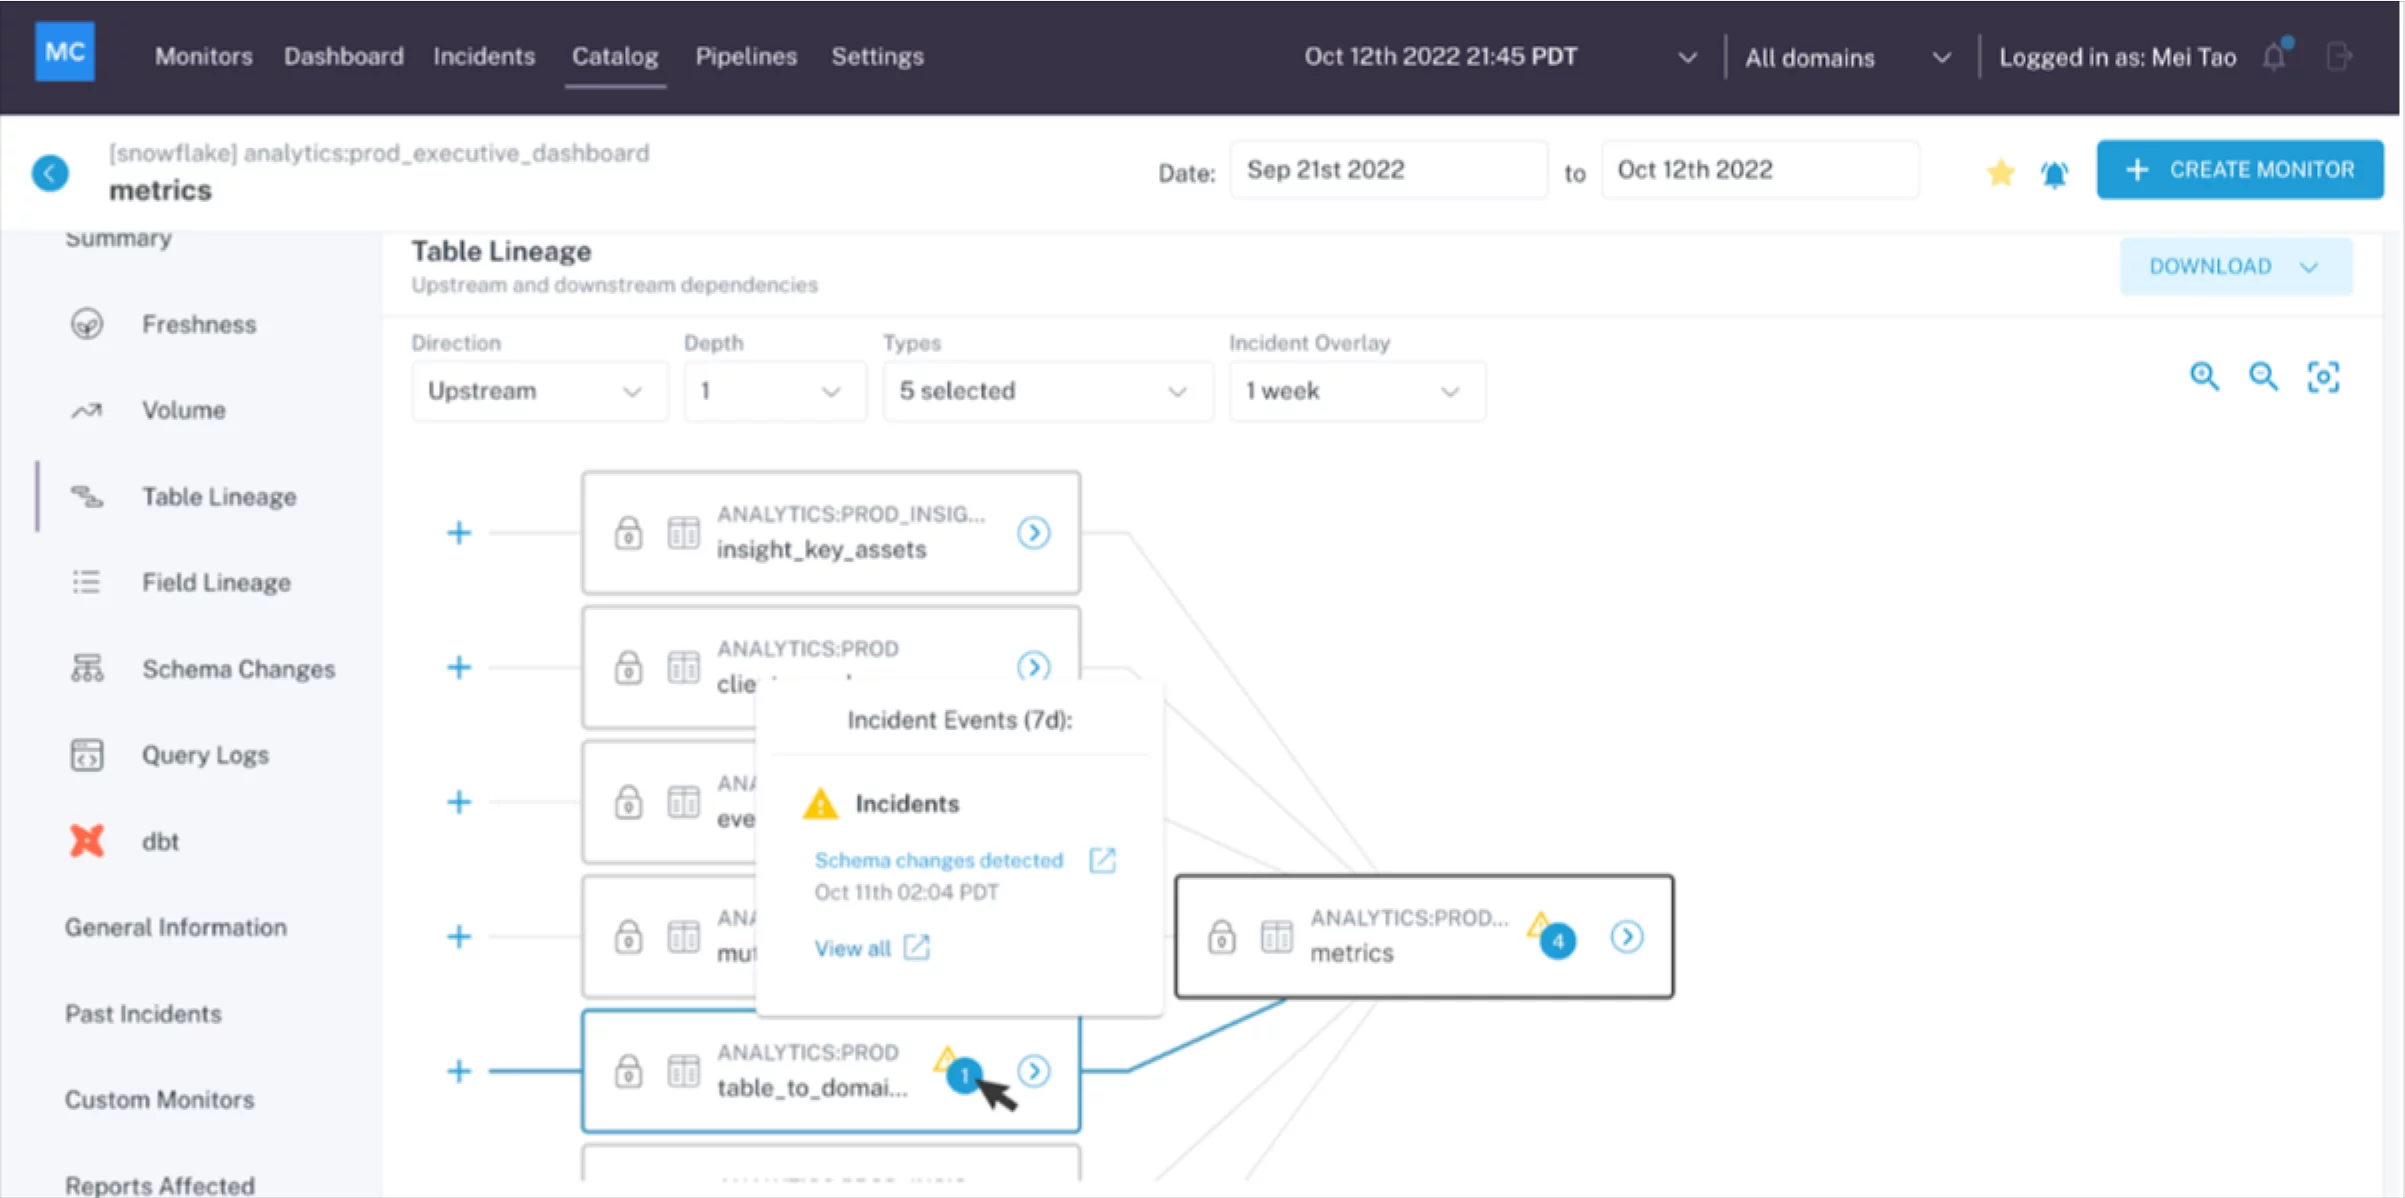
Monte Carlo’s New Sigma Integration Helps Data Teams Prevent Broken, Stale Dashboards
Monte Carlo has announced a new Sigma integration feature that helps data teams identify data accuracy issues before they cause broken or stale dashboards. The new feature can detect data accuracy issues and notify data teams before they impact dashboard reports. By integrating with Sigma, Monte Carlo can help prevent the spread of inaccurate data throughout an organization, reducing the risk of costly errors and mistakes. The post also includes information about managing cookie consent on the Monte Carlo website.
#DataTeams #DataDashboards #MonteCarloSigma #softcorpremium
Log Clustering in Azure Data Explorer - Microsoft Community Hub
The blog post discusses log clustering in Azure Data Explorer, a cloud-based service that provides fast and highly scalable data exploration and analytics. The post explains how log clustering can help identify patterns and anomalies in log data, which can be useful for troubleshooting and monitoring. It also provides examples of how to use log clustering in Azure Data Explorer, including how to create a clustering model and how to visualize the results. Overall, the post provides valuable insights for those interested in using log clustering to improve observability in their cloud-based systems.
#AzureDataExplorer #logclustering #softcorpremium
Datadog Releases Data Streams Monitoring to Assess Streaming Data Pipeline Performance | Datadog
Datadog has launched a new feature called Data Streams Monitoring that enables users to assess the performance of their streaming data pipelines in a centralized manner. The new feature provides real-time visibility into the health of streaming data pipelines, enabling users to quickly identify and troubleshoot issues as they arise. Data Streams Monitoring is a valuable addition to Datadog's observability platform, which already includes tools for infrastructure, application, and log monitoring, among other capabilities.
#DataStreamsMonitoring #PerformanceAssessment #softcorpremium
Announcing the Elastic Common Schema (ECS) and OpenTelemetry Semantic Convention Convergence | OpenTelemetry
OpenTelemetry and Elastic jointly announce the convergence of Elastic Common Schema (ECS) and OpenTelemetry Semantic Conventions into a single open schema maintained by OpenTelemetry, with the goal of improving the convergence of observability and security in the space.
#OpenTelemetry #ElasticCommonSchema
Stay in control of your data retention with Dynatrace Grail—from 10 days to 10 years | Dynatrace news
The blog post discusses the importance of managing observability and business-data storage while optimizing cost and availability, and staying compliant with internal and external policies and regulations. It introduces the new custom buckets in the Dynatrace Grail data lakehouse that allow customers to control their data retention, make data available at all times, and avoid data management overhead. The post also highlights the value of keeping historical data for analysis while balancing the costs and overhead of storage, archiving, and retrieval.
#dataretention #observability #compliance #softcorpremium
Build and operate multicloud FaaS with enhanced, intelligent end-to-end observability | Dynatrace news
This blog post discusses the challenges of observability in serverless applications and how to overcome them. It also introduces Dynatrace's automation and intelligent end-to-end observability for AWS Lambda, Azure Functions, and Google Cloud Functions.
#serverless #observability #FaaS #softcorpremium
Exploratory and collaborative analytics democratize insights | Dynatrace news
Exploratory and collaborative analytics can help teams understand the stories hidden within big data, allowing for easier collaboration between siloed teams. Dynatrace offers interactive dashboards that allow users to parse through increased data volumes with straightforward visualizations of data in context.
#exploratoryanalytics #collaborativeanalytics #bigdata #softcorpremium
Stay ahead of the game: Forecast IT capacity with Dynatrace Grail and Davis AI | Dynatrace news
Learn how to forecast IT capacity demands with Dynatrace Grail and Davis AI. This blog post explains the importance of anticipatory management in cloud-resource management, which is critical for modern companies that deploy highly dynamic services globally on demand. The traditional approach of reactive alerting doesn't scale up to address these requirements; instead, operators need tools like Grail and Davis AI to predict future resource needs based on measured data.
#Dynatrace #Grail #DavisAI #softcorpremium
Introducing the Dynatrace Platform Subscription: Flexible pricing for modern cloud observability and security | Dynatrace news
Dynatrace introduces the Platform Subscription, a flexible pricing model for cloud observability and security. With DPS, customers make an annual spend commitment at the platform level to gain full access to any capability in any quantity at any time with no hidden fees or monthly commitments. The subscription is underpinned by an Account Management Portal that offers granular transparency into usage trends.
#cloud #observability #security #softcorpremium