💡
Attention readers! We want to let you know that the summaries in this newsletter are generated using cutting-edge generative AI technology. However, we understand the importance of accuracy and quality content, so our team of expert editors manually reviews each summary before it's published. If you feel the quality of a particular summary does not meet your expectations, please leave a comment in the Member Discussion section below. We will rectify it as soon as humanly possible!
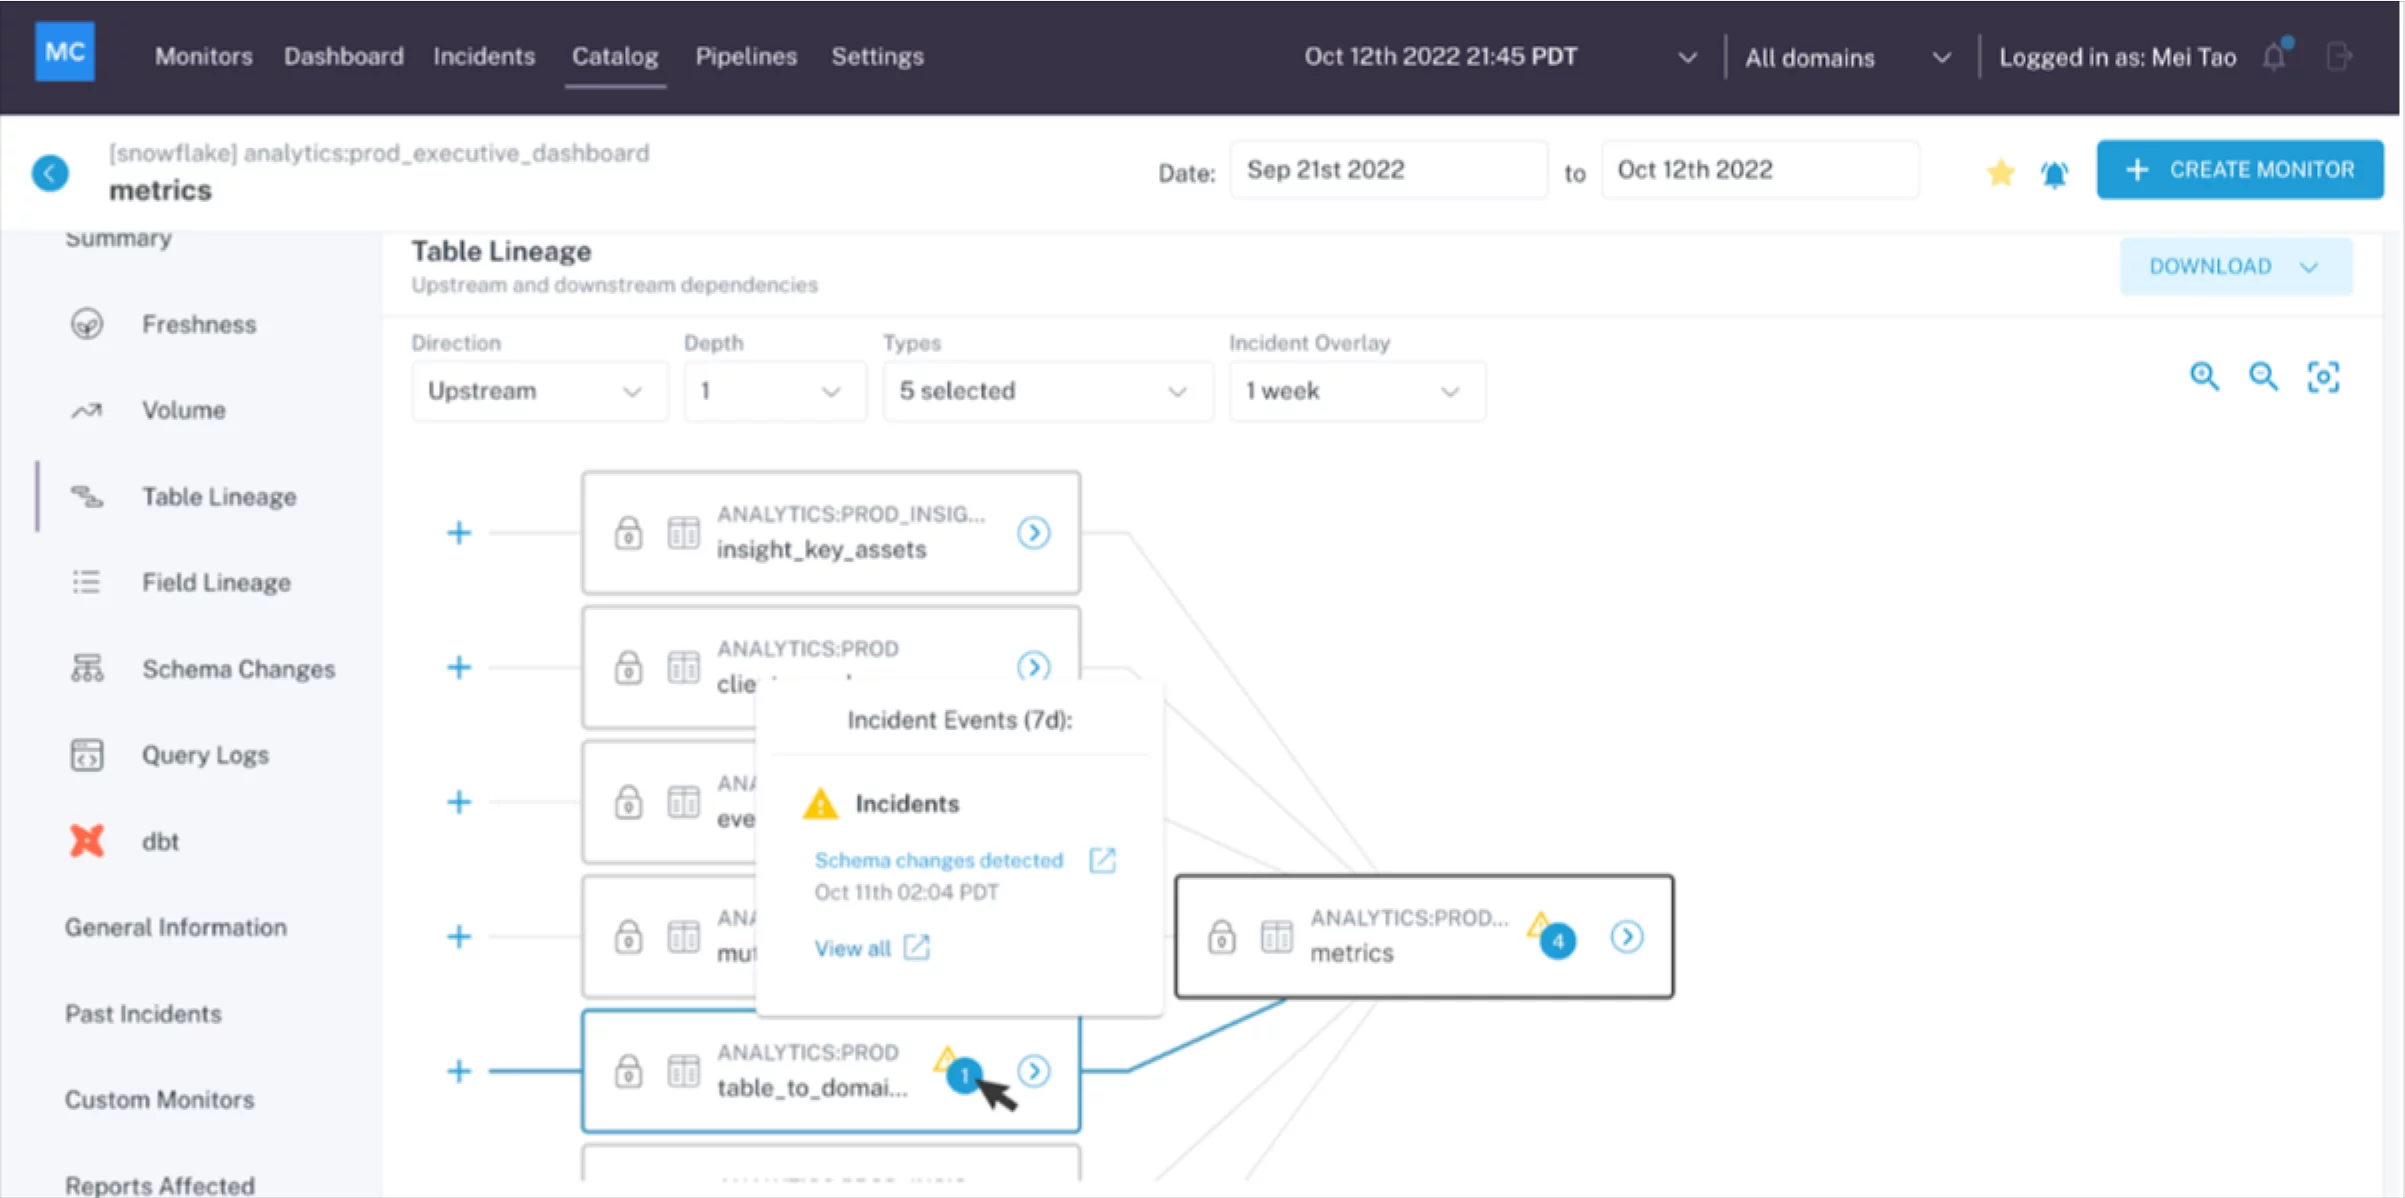
Scaling Data Observability To Transactional Databases With Monte Carlo’s Postgres, MySQL, And Microsoft SQL Server Integrations
Monte Carlo's data observability platform now integrates with Postgres, MySQL, and Microsoft SQL Server to help data teams detect and resolve data quality issues faster. These integrations automate data quality monitoring for transactional databases, allowing teams to benefit from monitoring and alerting across both. Postgres and MySQL are free and open-source, making them especially easy to adopt, and of course, they are still a standard part of many applications.
#DataObservability #PostgreSQL #MySQL #MS_SQL_Server #softcorpremium
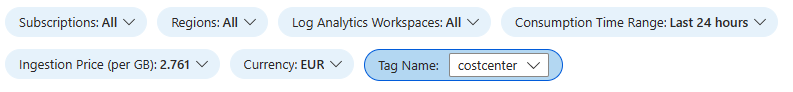
How to Allocate Azure Monitor Logs Ingestion Costs by Resource Tag - Microsoft Community Hub
This blog post explains how to allocate Azure Monitor Logs ingestion costs by resource tag. It provides step-by-step guidance on how to create a diagnostic setting, select the resource and log types, and then enable the setting for the resource group. By using resource tags, users can easily group and allocate the ingestion costs based on their specific needs. The post also includes helpful tips and considerations to keep in mind when working with Azure Monitor Logs.
#Azure #monitoring #logs #softcorpremium
How Swimply Built Its Hyper Growth Data Stack With Snowflake, Fivetran, And Monte Carlo
This post talks about how Swimply built its hyper-growth data stack with Snowflake, Fivetran, and Monte Carlo. The post highlights the various technologies used in the data stack and how they helped Swimply achieve its business goals.
#Snowflake #Fivetran #MonteCarlo #softcorpremium
DevSecOps for reliable, secure retail experiences | Dynatrace news
The explosive demand for online shopping has led to a shift towards delivering reliable, secure shopping experiences for customers in the retail sector. IT leaders in the industry are seeking to balance the need for speed, quality, and security in their digital services. A significant challenge is maintaining the reliability and security of omnichannel innovation as critical applications change constantly. This pressure has led to the growth of DevSecOps culture and automation to ensure success. Retailers are also forced to make tradeoffs between quality, security, and user experience which can be costly.
#DevSecOps #observability #retail #softcorpremium
Datadog Integrates With OpenAI ChatGPT to Help Organizations Monitor AI Usage, Costs and Performance | Datadog
Datadog has integrated with OpenAI ChatGPT to help organizations monitor the usage, costs, and performance of artificial intelligence (AI). This integration will help users generate a summary of their AI logs, monitor the performance of their models, and track their costs. The integration is aimed at improving observability and increasing the efficiency of AI usage.
#AI #monitoring #performance #softcorpremium
Monitor Your OpenAI Usage With Datadog | Datadog
Datadog has introduced a new integration that allows users to monitor their OpenAI usage. The integration enables users to see how much they are spending on OpenAI resources and monitor the performance of their OpenAI models. The integration provides visibility into the usage and costs of OpenAI resources, as well as the ability to correlate OpenAI metrics with other data sources in Datadog, such as logs and traces.
#Datadog #OpenAI #softcorpremium
What are DevOps monitoring tools? | Dynatrace news
This blog post discusses the importance and challenges of DevOps monitoring in today's fast-paced digital world. It covers different types of DevOps monitoring and their use cases. The post also highlights the need for advanced observability to achieve DevOps efficiency. DevOps monitoring tools automate data collection and analysis for agile software development, and play a crucial role in ensuring the smooth operation of software applications and infrastructure in a DevOps environment.
#DevOps #monitoring #observability #softcorpremium
What is an open ecosystem? | Dynatrace news
This blog post discusses the concept of open ecosystems in software computing, where organizations and applications share data and services for joint value creation. While open ecosystems offer benefits such as increased flexibility and improved collaboration, they also present new observability challenges that require increased integration of heterogeneous telemetry data. The post emphasizes the need for ecosystem-level observability planning to reap the benefits of open ecosystems and combat the challenges they present. Dynatrace's approach to embracing open ecosystems is also highlighted.
#openecosystem #observability #integration #softcorpremium
Exponential Histograms
The blog post discusses the use of exponential bucket histograms as an alternative to explicit bucket histograms in observability. Exponential histograms work by calculating bucket boundaries using an exponential growth function to ensure constant relative error for every bucket. Scale factor is an important consideration in selecting appropriate buckets, and the post provides examples of reasonable scale factors for different applications.
#histograms #exponentialbucket #Prometheus #softcorpremium
Overcoming Kubernetes Monitoring Challenges with Observability | Logz.io
Logz.io discusses the challenges of monitoring Kubernetes due to its additional layers of abstraction, which create complexity for observability. The flexibility of Kubernetes allows for fast deployment of applications, but this also introduces security risks and vulnerabilities. The post highlights the need for proactive scanning and monitoring to ensure the security of production environments. The evidence of these Kubernetes challenges is supported by data from around 500 survey responses from personas ranging from DevOps to Security.
#Kubernetes #observability #security #softcorpremium
3 Observability Takeaways from DevOps Pulse 2023 | Logz.io
The blog post discusses the trends in observability landscape from the 2023 DevOps Pulse survey. The main takeaway is the concerning increase in mean time to recovery (MTTR) for organizations, with over 75% of responses stating that their MTTR exceeds multiple hours. The post highlights the factors impacting MTTR, including complex cloud technologies, siloed telemetry data, and overall data pipeline monitoring and performance. The authors suggest creating service-level objectives around MTTR to overcome these issues.
#observability #MTTR #DevOpsPulse #softcorpremium
OpenTelemetry and Cloud Trace: Usage and More | by Irvi Aini | Google Cloud - Community | Apr, 2023 | Medium
Irvi Aini writes about OpenTelemetry and Cloud Trace on Google Cloud Platform, explaining how developers can use Cloud Trace to analyze and troubleshoot their applications' performance, and how OpenTelemetry provides a unified way to generate, collect, and export telemetry data for observability.
#OpenTelemetry #CloudTrace #softcorpremium
Have a JSON headache in KQL? Try mv-expand or mv-apply – Microsoft Sentinel 101
The post explains how to handle multi-value sets of data in KQL, specifically JSON arrays with multiple objects and nested arrays. The post suggests using mv-expand or mv-apply to make sense of the data. It provides an example of Azure AD Conditional Access policy evaluation data.
#KQL #JSON #softcorpremium