Observability News for March 28th, 2023
A weekly post with all the latest Observability news. #observability #softcorpremium #news


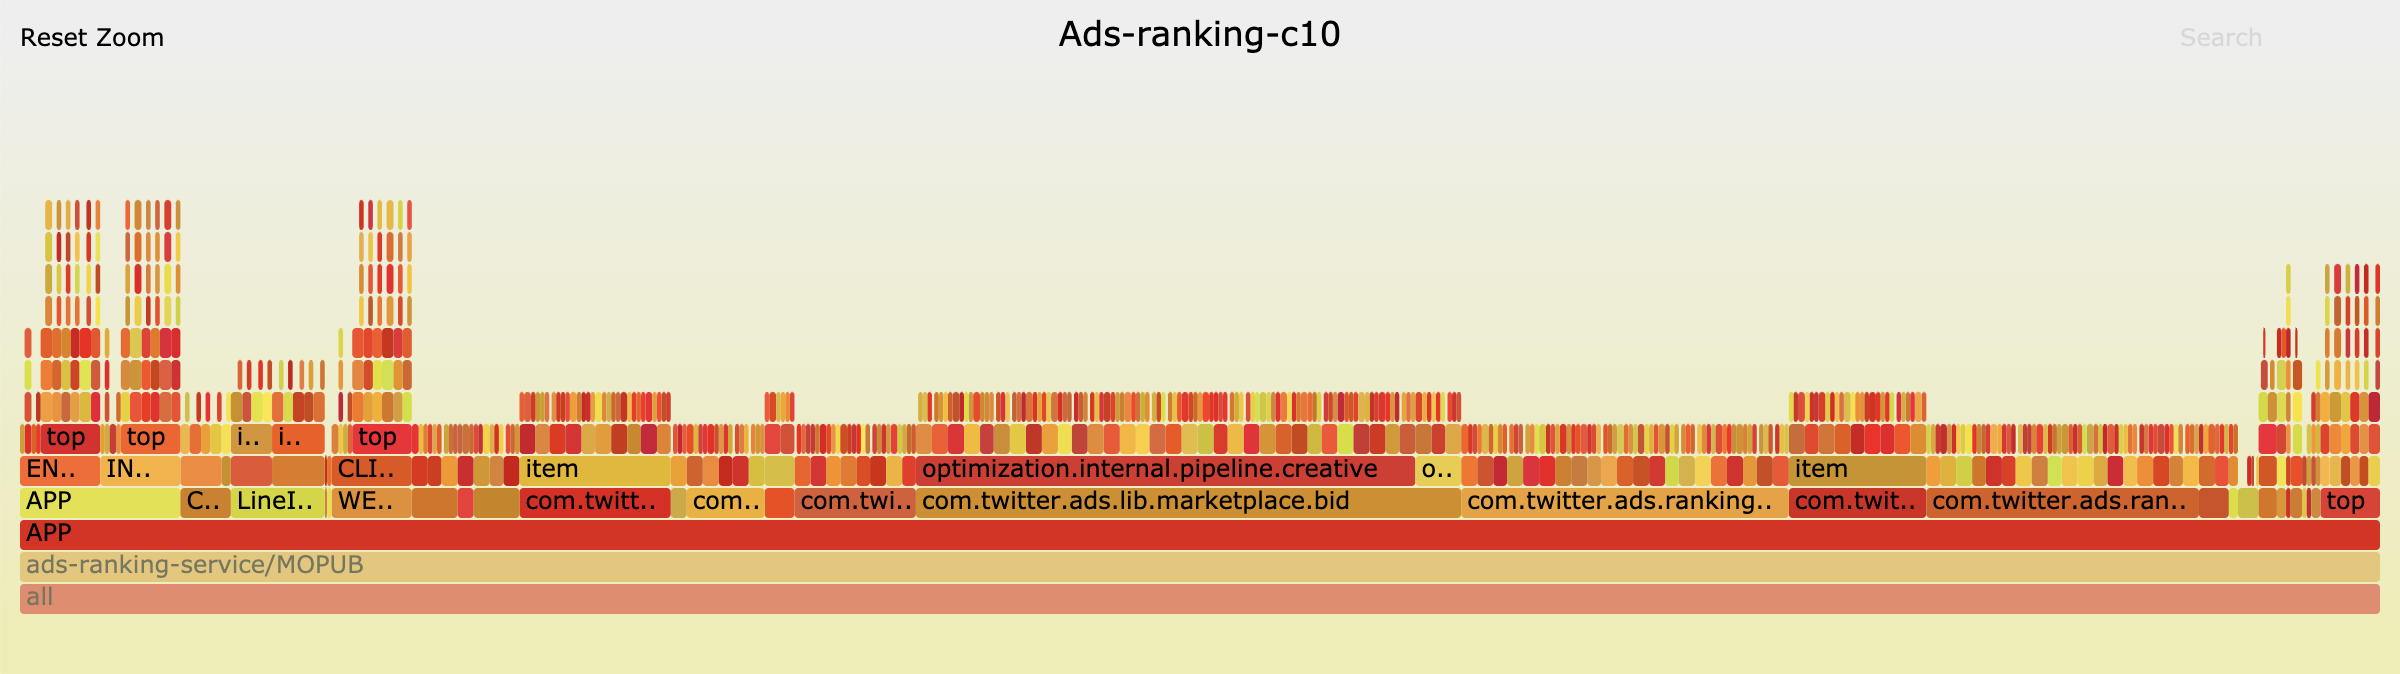
Applying flame graphs outside of performance analysis
Flame graphs are commonly used for CPU performance analysis but have seen limited adoption outside of these use cases. The Observability team at Twitter utilized flame graphs to determine scaling factors contributing to increased metric ingestion for their time series database.
#FlameGraphs #Observability
| View » | Share on Linkedin » | Tweet » | Toot » |

Realtime monitoring of microservices and cloud-native applications with IBM Instana SaaS on AWS
The post discusses how customers are utilizing microservices architecture on AWS and seeking observability solutions to effectively monitor and manage their application performance in real-time, with IBM Instana being one such solution.
#microservices #AWS #observability
| View » | Share on Linkedin » | Tweet » | Toot » |

Announcing preview: Collect Syslog from your AKS nodes using Container Insights
Azure Monitor Container Insights now allows customers to collect Syslog from Linux nodes in their Azure Kubernetes Service (AKS) clusters for improved observability and unified security. By collecting syslog natively using the Azure Monitor Agent, customers can easily store, query, and visualize their data using tools in the Azure Monitor ecosystem.
#AzureMonitor #ContainerInsights
| View » | Share on Linkedin » | Tweet » | Toot » |

Centralized Log Management Best Practices and Tools
Centralized logging is crucial for observability in modern infrastructure and applications, as it enables engineers to diagnose problems and understand user experiences by providing access to log data.
#CentralizedLogging #Observability #ModernInfrastructure
| View » | Share on Linkedin » | Tweet » | Toot » |
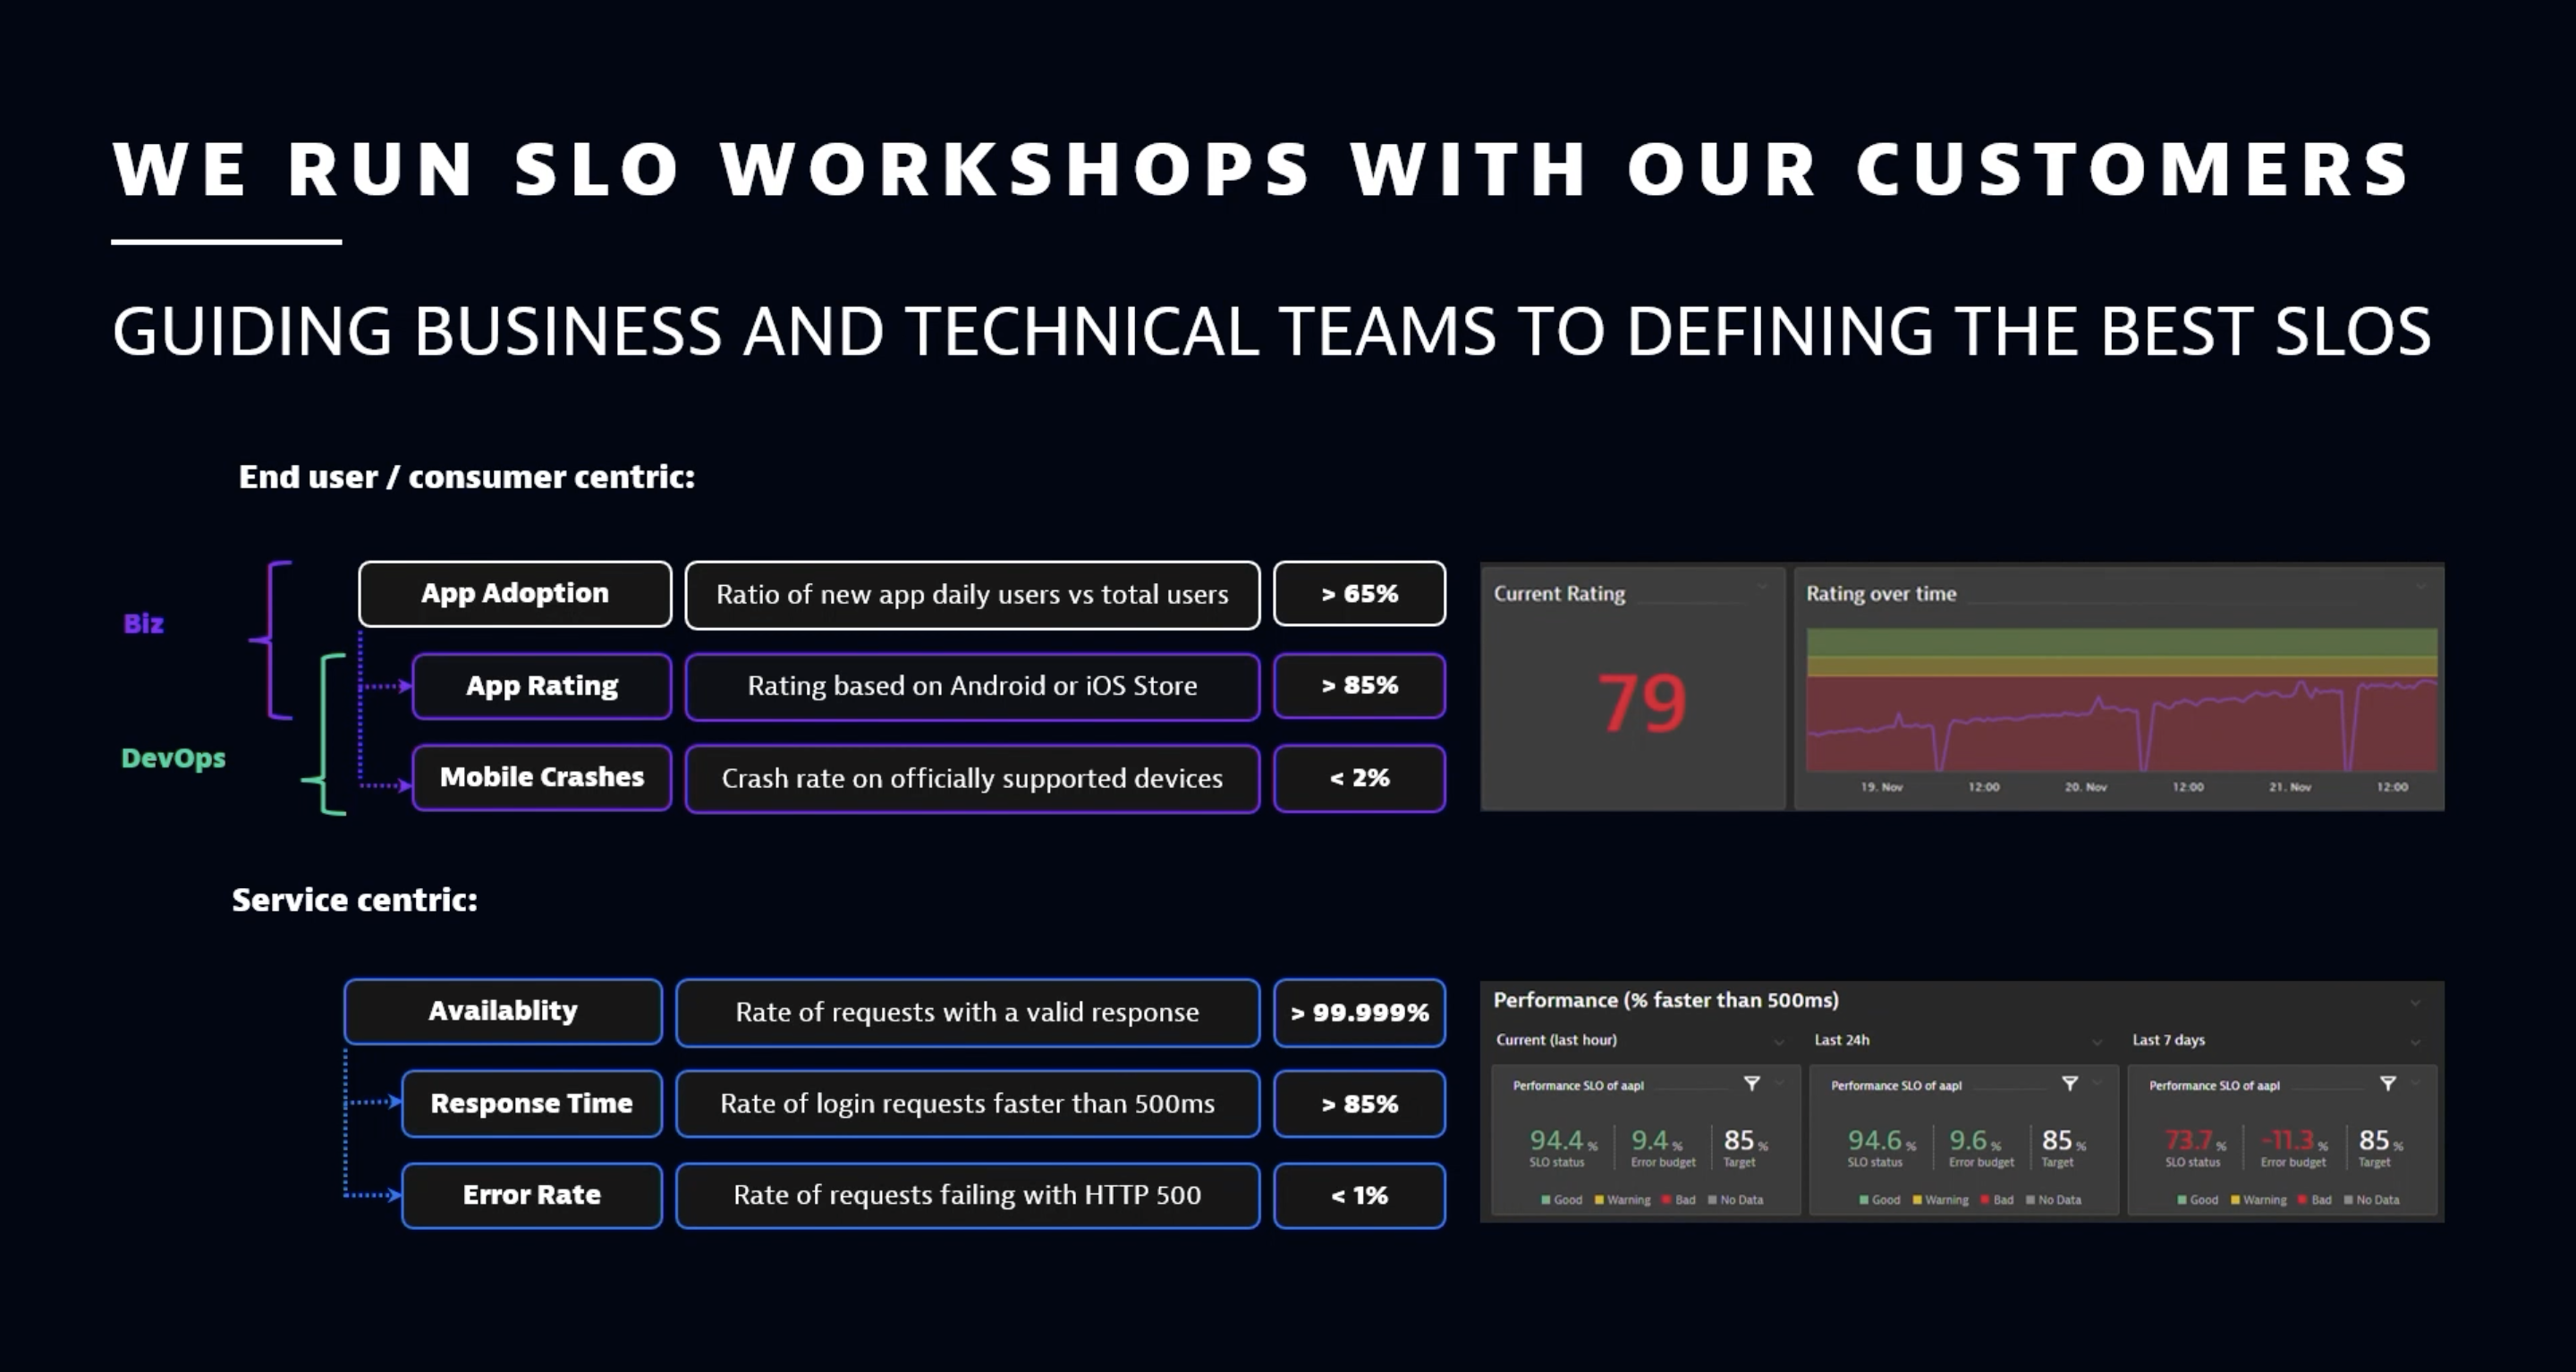
SLOs done right: how DevOps teams can build better service-level objectives
The blog post discusses the importance of service-level objectives (SLOs) for DevOps and SRE teams in aligning technical success with business objectives. It highlights the key components of a good SLO, SLOs to avoid, and offers advice on how to build better SLOs.
#DevOps #SRE
| View » | Share on Linkedin » | Tweet » | Toot » |
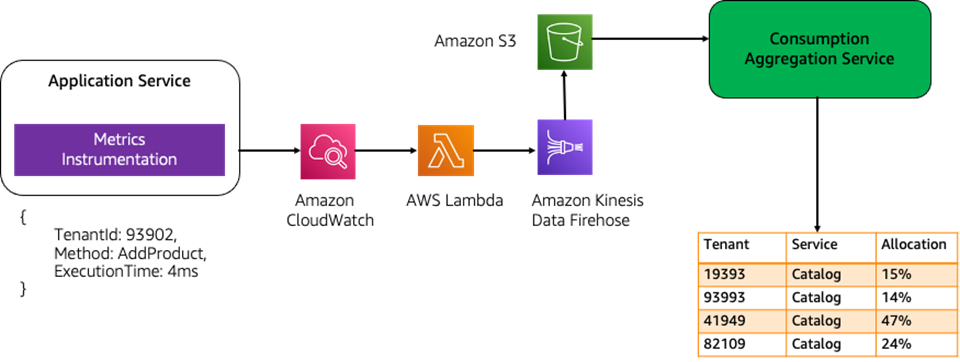
Optimizing Cost Per Tenant Visibility in SaaS Solutions
The post discusses the challenge of measuring resource consumption in SaaS solutions and offers insights on how to use this data to optimize SaaS architecture and make informed business decisions.
#SaaS #architecture
| View » | Share on Linkedin » | Tweet » | Toot » |
![]()
Dynatrace Managed release notes version 1.262
Dynatrace Managed release notes version 1.262 includes a new branding logo in Managed deployments and added support for Oracle Linux 8.7, 9.0, and 9.1. The release also contains information on future and past operating systems support changes.
#Dynatrace #Managed
| View » | Share on Linkedin » | Tweet » | Toot » |
Verify POST endpoint availability with Uptime Checks
Google Cloud Monitoring’s Uptime checks is a lightweight observability tool that enables application owners to easily monitor the performance of an application’s critical user journeys. The tool now supports POST requests with any content type, enabling comprehensive monitoring and response validation matching.
#GoogleCloudMonitoring #UptimeChecks
| View » | Share on Linkedin » | Tweet » | Toot » |

Preserving authorship in a GitOps world with Kyverno
The post discusses the challenge of identifying the author of Kubernetes resources in GitOps and suggests using Kyverno CLI to automate the process by assigning team names or individual owners as labels or annotations to the resources.
#GitOps #KyvernoCLI
| View » | Share on Linkedin » | Tweet » | Toot » |

Is Managed Prometheus Right For You?
Prometheus is an open-source tool used for collecting and monitoring metrics data. Its versatility and ease of use make it a popular choice for integrating with cloud-native systems.
#Prometheus #cloudnative
| View » | Share on Linkedin » | Tweet » | Toot » |

AppDynamics Cloud integrates with Grafana to add key metrics for dashboards
Cisco AppDynamics has created an open-source integration for AppDynamics Cloud customers to expand support and use cases for Grafana, making it easier to visualize data from AppDynamics Cloud with the dashboarding tool.
#Cisco #AppDynamics #Grafana
| View » | Share on Linkedin » | Tweet » | Toot » |
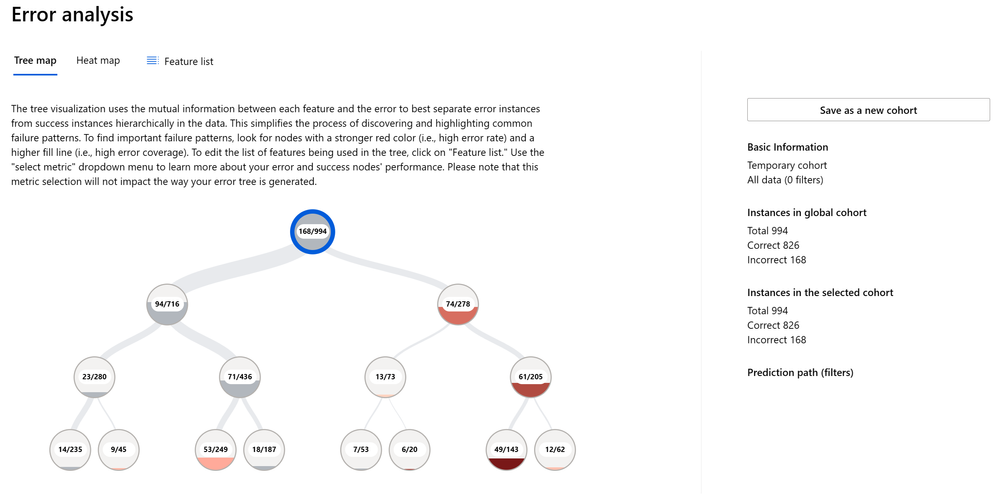
How to perform Error Analysis on a model with the Responsible AI dashboard (Part 4)
The post discusses the limitations of traditional performance metrics for machine learning models and emphasizes the importance of identifying error distribution in data to ensure model fairness and reliability. It introduces the Error Analysis component of Azure Machine Learning Responsible AI dashboard as a tool for identifying a model's error distribution across its test dataset.
#MachineLearning #ResponsibleAI
| View » | Share on Linkedin » | Tweet » | Toot » |

Splunk adds new security and observability features
Splunk is enhancing its Observability Cloud and Mission Control with new security and observability features that will aid in identifying threats and incidents more efficiently. The updates will provide IT and development operation teams with increased visibility, allowing for a unified approach to incident response.
#Splunk #ObservabilityCloud #MissionControl
| View » | Share on Linkedin » | Tweet » | Toot » |
Dynatrace Managed release notes version 1.258
Dynatrace Managed released version 1.258, which includes features such as the ability to check Mission Control connection status and a new cluster event message in case of a node's inability to receive OneAgent traffic. This release also updates the procedure to replicate nodes across data centers to make it easier and more resilient.
#DynatraceManaged #MissionControl #DataCenters
| View » | Share on Linkedin » | Tweet » | Toot » |
Break down the barriers to end-to-end monitoring with Dynatrace
Dynatrace has announced the release of cross-environment tracing, which allows businesses to trace individual distributed traces across multiple environments while still providing a comprehensive view. This new feature is designed to help reduce the restrictions of end-to-end monitoring.
#CrossEnvironmentTracing #EndtoEndMonitoring #Dynatrace
| View » | Share on Linkedin » | Tweet » | Toot » |
How the DoD’s Joint Warfighter Cloud Capability (JWCC) will Improve Mission-Supporting Cloud Performance and Security
The Department of Defense has launched the Joint Warfighter Cloud Capability, a series of contracts that provide enterprise cloud computing services to the DoD. It is not mandatory but will be the only vehicle through which authorized cloud offerings that handle unclassified data can be accessed.
#JointWarfighterCloud #DoD #CloudComputing
| View » | Share on Linkedin » | Tweet » | Toot » |
Tech Transforms podcast: Favorite episodes of the So What? Federal News Roundup from 2022
The Tech Transforms podcast, sponsored by Dynatrace, features interviews with influential government technology decision makers. The Dynatrace blog recently featured a roundup of the most popular episodes of the podcast from 2022.
#TechTransforms #Dynatrace #GovernmentTechnology
| View » | Share on Linkedin » | Tweet » | Toot » |
Set up AI-powered observability for your Microsoft Azure cloud resources in just one click
Dynatrace customers using the Azure Native Dynatrace Service can now integrate Dynatrace and Azure Monitor with just one click, enabling AI-powered observability of their complete workloads in Azure. The integration is automatically set up in the background with no further action required.
#Dynatrace #AzureMonitor #AIObservability
| View » | Share on Linkedin » | Tweet » | Toot » |
Beginner’s Guide to Prometheus Metrics
Prometheus has become a widely used open source monitoring tool in the last 10 years, due to its ability to easily collect system metrics and identify problems in cloud infrastructure and applications. Developed by SoundCloud, Prometheus was created to fill the need for more comprehensive metrics and monitoring solutions.
#Prometheus #CloudInfrastructure #Monitoring
| View » | Share on Linkedin » | Tweet » | Toot » |
Dynatrace SaaS release notes version 1.260
Dynatrace SaaS version 1.260 has been released, containing new features and enhancements such as on-demand synthetic monitor executions from any location and the ability to view any user action for mobile and custom applications.
#Dynatrace #SaaS #OnDemand
| View » | Share on Linkedin » | Tweet » | Toot » |
Visualize real-time mobile app data with the Embrace data source plugin for Grafana
Chakshu Mehta is a principal product marketer at Embrace, helping customers build amazing mobile app experiences by providing best-in-class mobile insights. Today, the introduction of a new Embrace data source plugin for Grafana enables teams to visualize and analyze Embrace mobile golden signal metrics directly in Grafana, allowing them to gain full-stack mobile app observability.
#grafana #mobileapp #mobileinsights
| View » | Share on Linkedin » | Tweet » | Toot » |
Dynatrace AppEngine: Everything thinkable is now possible
Dynatrace has revolutionized the analysis of observability, security, and business data at any scale with their introduction of Grail. Additionally, they have further expanded their platform capabilities with Dynatrace AutomationEngine and Dynatrace AppEngine, enabling customers to create custom, compliant, and intelligent data-driven apps.
#Dynatrace #Observability #Security
| View » | Share on Linkedin » | Tweet » | Toot » |
Extending modern observability for exploratory analytics
Modern observability has enabled teams to operate clouds more efficiently and securely, while an analytics platform provides exploratory analytics capabilities for data-backed decision making. This has the potential to drive better business results.
#ModernObservability #CloudOperations #AnalyticsPlatform
| View » | Share on Linkedin » | Tweet » | Toot » |
Super bot for Kubernetes clusters
Vishal Anand, Utpal Mangla, Saurabh Agrawal and Luca Marchi have created a Super Bot, an all-in-one messaging bot for monitoring, notifying and debugging Kubernetes clusters. This modern bot is based on open-source technology and can be used to monitor events and enable health checks across multiple public and private clusters.
#Kubernetes #SuperBot #OpenSource
| View » | Share on Linkedin » | Tweet » | Toot » |
AppEngine empowers organizations to create custom apps for better data insights
Modern observability platforms provide root-cause analysis and data insights, but AppEngine allows organizations to create custom apps for even more specialized data insights. AppEngine is a tool that helps organizations make the most of their data insights.
#AppEngine #DataInsights #RootCauseAnalysis