Observability News for March 13th, 2023
A weekly post with all the latest Observability news. #observability #softcorpremium #news


Monitoring Storage Replication - Part 2
Felipe Binotto, a Cloud Solution Architect based in Australia, has outlined a process to create and configure an Azure Alert to notify the owner of a Storage Account which is defined as a tag value. This process involves configuring an Automation Runbook, Log Analytics workspace, Logic App, and using a custom log search query to identify the accounts in question.
#AzureAlert #StorageAccount #CloudSolutionArchitect
| View » | Share on Linkedin » | Tweet » | Toot » |
5 key takeaways from the Grafana Labs Observability Survey 2023
Observability is becoming increasingly important for SREs and DevOps practitioners who are seeking to centralize their tools and data sources for better workload management and incident response. The complexity of modern applications and infrastructure has led to a shift from traditional monitoring to observability best practices, with companies juggling multiple tools and data sources while at different stages in their observability journey.
#Observability #SREs #DevOps
| View » | Share on Linkedin » | Tweet » | Toot » |
AWS Glue now provides continuous logs in AWS Glue Job Monitoring
AWS Glue Studio has introduced a feature that displays continuous logs on the job run details page. This serverless data integration and ETL service helps integrate and move data for analytics and ML, with real-time updates available as jobs run.
#AWSGlueStudio #datamigration #ETLservice
| View » | Share on Linkedin » | Tweet » | Toot » |

Debugging your Power app for the code first developer
The article discusses how code first developers can use Microsoft Power Platform and specifically Canvas apps for debugging. The platform provides different approaches for debugging, such as log/assertion, breakpoints, and tests, that are essential tools for ensuring the code works as intended.
#MicrosoftPowerPlatform and #CanvasApps would be appropriate hashtags for this LinkedIn post.
| View » | Share on Linkedin » | Tweet » | Toot » |
Public Preview: Azure Monitor managed service for Prometheus now supports querying PromQL
The public preview of Azure Monitor's managed service for Prometheus, now allows users to run PromQL queries and create custom reports using Azure Workbooks.
#MicrosoftEdge #AzureMonitor #PromQL
| View » | Share on Linkedin » | Tweet » | Toot » |

Automatically convert Grafana Dashboards from InfluxQL to PromQL with a new open source tool
The post discusses open source solutions for metrics monitoring, focusing on the popular time series databases Prometheus and InfluxDB as well as the visualization tool Grafana. It also compares and contrasts the query languages used by each database and explores the challenges of migrating from InfluxDB to Prometheus while maintaining the same frontend.
#Prometheus #InfluxDB #Grafana
| View » | Share on Linkedin » | Tweet » | Toot » |

Let’s Architect! Architecting a data mesh
The data architectures of the past were focused on technologies rather than business domains until Zhamak Dehghani introduced the data mesh in 2019. This approach applies DDD principles to data architectures, organizing data into domains and making it the product owned by the team.
#DataMesh #DDDPrinciples #DataArchitecture
| View » | Share on Linkedin » | Tweet » | Toot » |

Troubleshoot faulty frontend deployments with Deployment Tracking in RUM
Constant deployments, often occurring multiple times a day, are essential for keeping customers engaged, but they also make it difficult to identify the source of errors or performance regressions. This necessitates increased vigilance in monitoring and optimizing apps.
#DevOps #ContinuousDelivery #PerformanceOptimization
| View » | Share on Linkedin » | Tweet » | Toot » |
Public Preview: Collect Syslog from AKS nodes using Azure Monitor - Container Insights
Azure Monitor Container Insights now allows customers to collect Syslog from nodes in their Azure Kubernetes Service (AKS) clusters, enabling monitoring of security and health events across IaaS and containerized workloads. This feature combines with SIEM systems like Microsoft Sentinel and observability tools like Azure Monitor.
#AzureMonitor #ContainerInsights #AKS
| View » | Share on Linkedin » | Tweet » | Toot » |

Announcing the General Availability of Azure Virtual Desktop Insights at Scale
Azure Virtual Desktop Insights at Scale is now generally available, offering reporting of key information across resources in one view, with several requested features such as unified user searching and round-trip time reporting. No additional configuration or setup is required for existing AVD Insights users.
#AzureVirtualDesktop #AVDInsights #ScaleReporting
| View » | Share on Linkedin » | Tweet » | Toot » |
Answer-driven DevOps automation: Automation use cases that accelerate insights
The blog post discusses the importance of answer-driven DevOps automation for enterprises to accelerate insight, reduce unexpected downtime, and manage complex multicloud environments. It also highlights the obstacles faced by organizations in adopting DevOps principles due to manual processes and provides three steps for successful DevOps automation.
#DevOps #automation
| View » | Share on Linkedin » | Tweet » | Toot » |
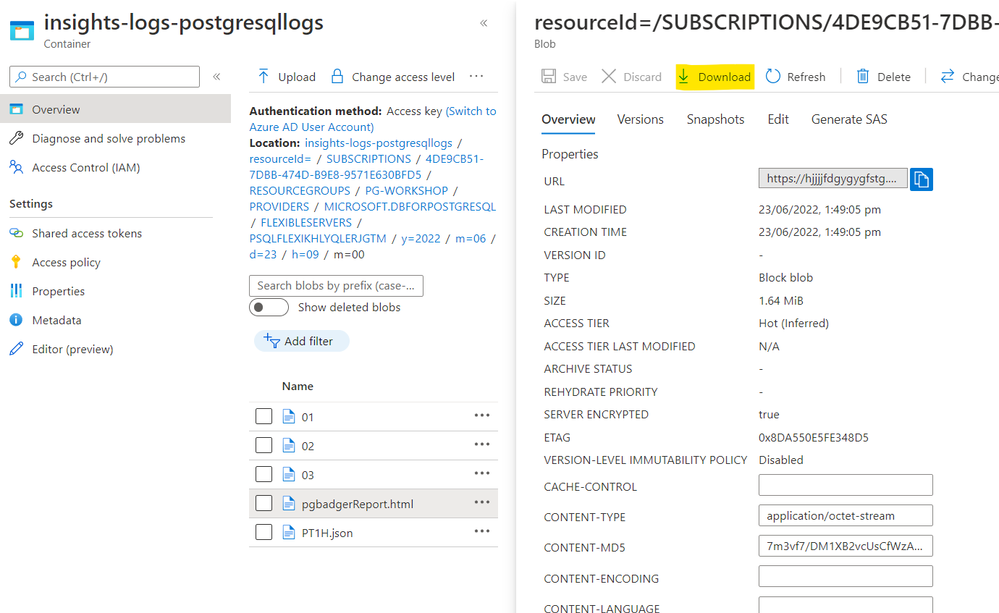
How to generate pgBadger report from Azure Database for PostgreSQL Flexible Server
PgBadger is a comprehensive Postgres troubleshooting tool that provides insight into a wide variety of events happening in the database, such as autovacuum actions, temporary files and locks. Users can generate a pgBadger report from Azure Database for PostgreSQL Flexible Server by adjusting Postgres configuration, creating a storage account, configuring diagnostic settings and mounting the storage account onto a Linux VM.
#Postgres #AzureDatabase #pgBadger
| View » | Share on Linkedin » | Tweet » | Toot » |
Monitoring PgBouncer in Azure PostgreSQL Flexible Server
PgBouncer is a widely used connection pooling software for Postgres, and it can be easily enabled on Azure Database for PostgreSQL Flexible Server. Recently, 6 new metrics to monitor PgBouncer performance were released, in order to help customers optimize their settings.
#PgBouncer #AzureDatabaseforPostgreSQL #Optimization
| View » | Share on Linkedin » | Tweet » | Toot » |

Announcing Log Monitor 2.0 Release Candidate
Log Monitor, an open-source tool for exposing Windows logs to the STDOUT pipeline, has released a new version that addresses feedback from customers about the lack of structured formatting for logs. The latest release includes improvements such as outputting JSON logs, including ETW provider name in ETW Log Output, and stability and quality improvements.
#LogMonitor and #WindowsLogs could be appropriate hashtags for this LinkedIn post.
| View » | Share on Linkedin » | Tweet » | Toot » |
New in Grafana Cloud: Key improvements to the command palette and navigation experience
Grafana Cloud will have a new navigation experience with an enhanced command palette that enables users to perform different actions and tasks by using their keyboard. Users can save time and work more efficiently in Grafana Cloud with the new features, including searching and navigating updates.
#GrafanaCloud #navigationexperience
| View » | Share on Linkedin » | Tweet » | Toot » |
Grafana Labs, Rancher, Splunk, and Zscaler integrations expand Consul ecosystem
Grafana Labs, Rancher, Splunk and Zscaler have announced integrations with Consul, further expanding the capabilities of the platform. This collaboration will provide users with more opportunities to benefit from the powerful features of the Consul ecosystem.
#GrafanaLabs #Rancher #Consul
| View » | Share on Linkedin » | Tweet » | Toot » |
Thinking about programs from a mathematical perspective to verify their correctness
The article by Tian Ye of DatenLord discusses the importance of understanding errors that may occur in computer programs and divides them into simple and logical errors. While simple errors can be easily found and fixed, logical errors are more difficult to identify and require higher-level analysis and design considerations.
#programmingerrors #logicalerrors #computerscience
| View » | Share on Linkedin » | Tweet » | Toot » |
Adopting SRE: Standardizing your SLO design process
SRE can be defined in various ways and is characterized by Service Level Objectives (SLOs). To successfully implement SLOs, teams need to have a common understanding of the workload and its critical user journeys, which involves modeling user journeys, decomposing them into SLOs, and considering aspects such as user expectations and measurement capabilities.
#SRE #SLOs
| View » | Share on Linkedin » | Tweet » | Toot » |
OpenSearch and Logz.io – Taking Observability to the Next Level
OpenSearch has become a major player in cloud engineering and DevOps space over the last few years and it is important to understand its basic components to gain a better understanding of it. A review of these concepts provides a good starting point.
#OpenSearch #CloudEngineering #DevOps
| View » | Share on Linkedin » | Tweet » | Toot » |
Generally available: App Insights Extension for Azure Virtual Machines and VM Scale Sets
Azure Monitor has released the App Insights Extension for Azure Virtual Machines and VM Scale Sets, which simplifies the process of monitoring .NET applications running on Azure VMs and VM scale sets. Customers can now easily enable Application Insights monitoring with minimal configuration or code changes.
#AzureMonitor #AppInsights #AzureVMs