Attention readers! We want to let you know that the summaries in this newsletter are generated using cutting-edge generative AI technology. However, we understand the importance of accuracy and quality content, so our team of expert editors manually reviews each summary before it's published. If you feel the quality of a particular summary does not meet your expectations, please leave a comment in the Member Discussion section below. We will rectify it as soon as humanly possible!
Gain full observability into Windows containers on Azure Kubernetes Service using Datadog - Microsoft Community Hub
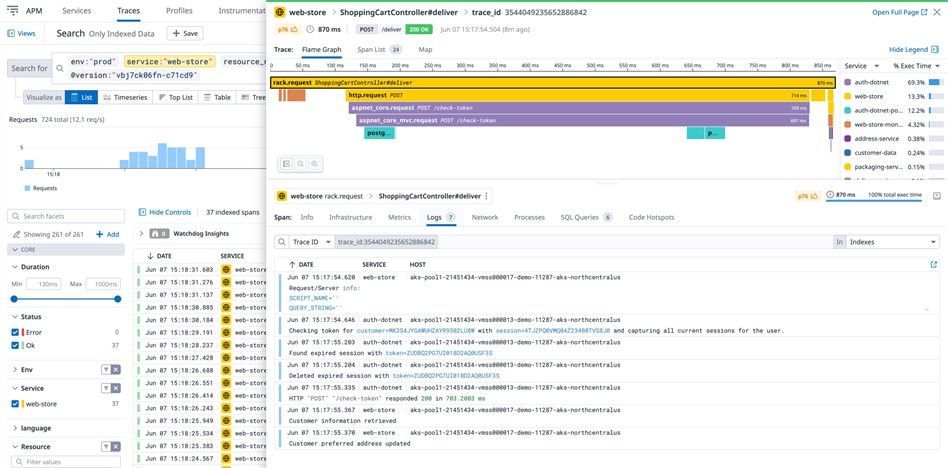
Observability is crucial in managing and troubleshooting applications in complex cloud-native environments. Datadog, an observability and security platform for cloud applications, can provide comprehensive insights into the health and performance of systems when combined with Windows on Azure Kubernetes Service (AKS). Datadog offers a set of tools to collect, analyze, and visualize metrics, logs, and traces for efficient troubleshooting, capacity planning, and performance optimization. Datadog can be easily deployed and managed using Helm, and provides pre-built dashboards and visualizations for monitoring Windows on AKS workloads. Its Live Container view provides real-time insights into the health and resource consumption of every container in an AKS cluster. By correlating logs with traces, Datadog's APM can easily identify the root cause of issues, troubleshoot errors, and optimize performance. Overall, Datadog provides a unified observability solution tailored to the specific needs of Windows on AKS deployments.
#observability #cloudnative #WindowsonAKS #softcorpremium
Unlocking Insights from Azure Activity Logs with Power BI - Microsoft Community Hub
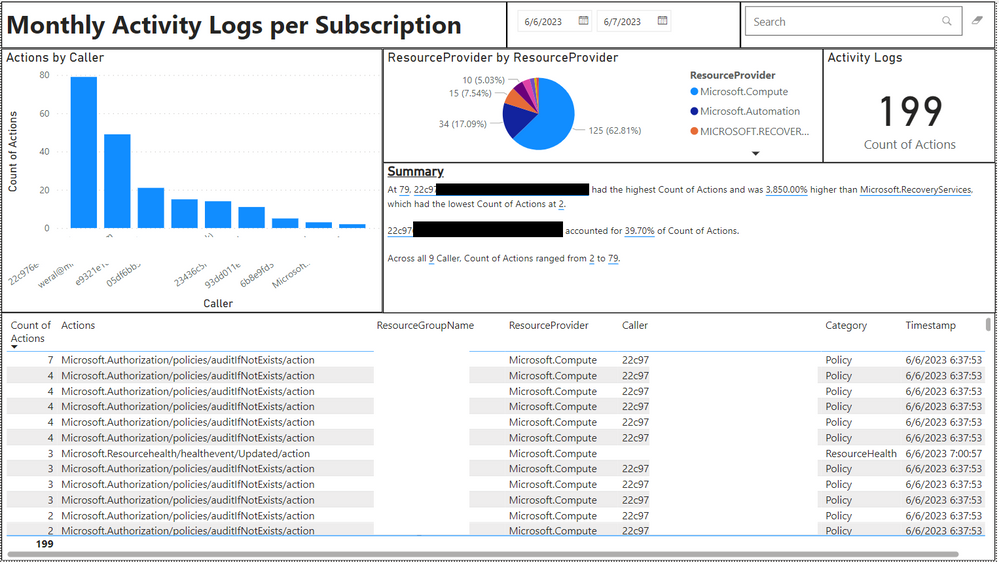
Power BI, a data visualization and business intelligence tool, can be used to analyze Azure Activity Logs. By leveraging Power BI's capabilities, complex log data can be transformed into actionable insights. This approach simplifies the process of monitoring and analyzing Azure activity data, providing a nuanced understanding of Azure environments at a glance. The installation process involves downloading a PBIT file from GitHub, entering the SubscriptionID, and manually editing the date and time in the query. This innovative approach streamlines the process of using APIs for Azure usage tracking. The sample scripts and Power BI Dashboards are provided without warranty and at the user's risk.
#PowerBI #AzureActivityLogs #BusinessIntelligence #softcorpremium
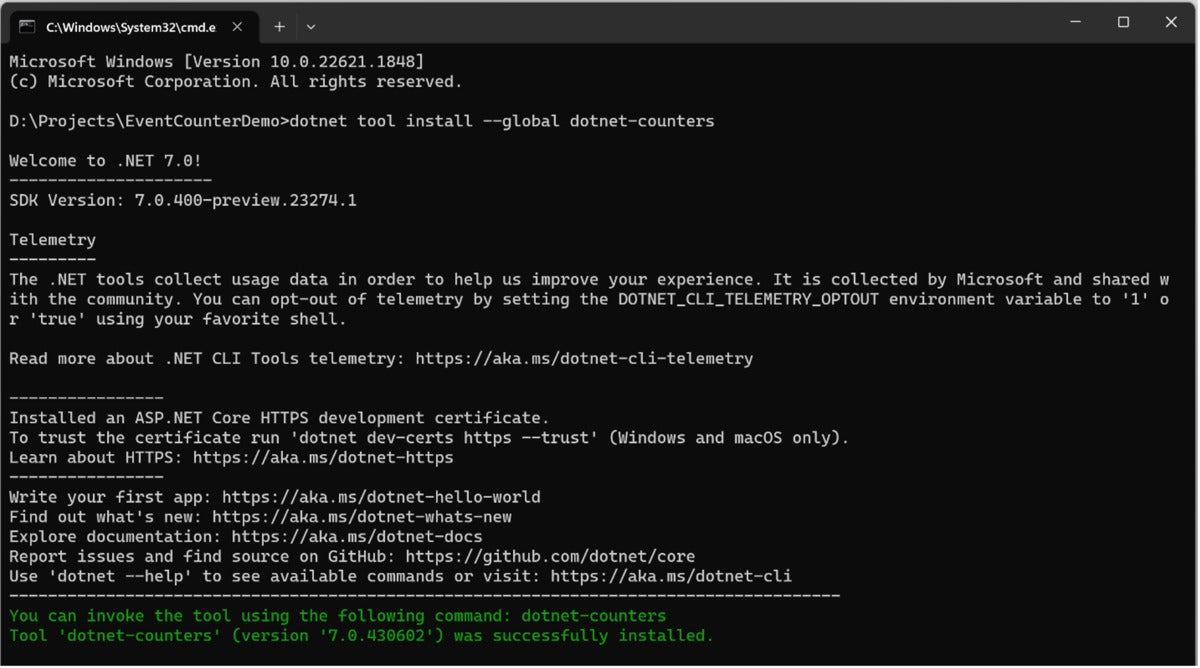
This article discusses how to work with EventCounters in .NET Core for profiling performance in applications before deploying to production. EventCounters provide lightweight performance metrics for tracking aspects such as CPU usage and memory consumption. To use EventCounters, a custom class that extends the System.Diagnostics.Tracing.EventSource class must be created. The dotnet-counters tool can be used to monitor the performance counters in .NET Core applications, and EventCounters can be consumed using EventListeners and EventPipes. However, it is important to note that EventCounters are primarily used for diagnostic and profiling purposes, not for monitoring health and performance in production.
#EventCounters #NETCorePerformance #ProfilingApplications #softcorpremium
Unlocking the Power of Kubernetes with K8SGPT | by Jasbir Singh | Google Cloud - Community | Jun, 2023 | Medium
K8SGPT is a tool that provides SREs with a simple and efficient way to scan Kubernetes clusters and diagnose issues in plain English. It comes equipped with built-in analyzers and the option to add optional analyzers or create custom ones. K8SGPT also offers integrations with other tools and an anonymization feature for security. Installation and usage instructions are provided, along with a link to the GitHub repository for more details.
#Kubernetes #SREtools #K8SGPT #softcorpremium
Distributed Tracing — Past, Present and Future | by Samyukktha | Jun, 2023 | Medium
Distributed Tracing is a technology that tracks a single request as it moves through different components of a distributed system by capturing network calls as spans. The need for distributed tracing arises from its focus on requests as the unit for observability, whereas traditional monitoring platforms observe services or hosts. Despite being regarded as a crucial aspect of observability, the adoption of distributed tracing is only at around 25%. Upcoming developments aim to address challenges by improving instrumentation and standardizing tracing protocols. OpenTelemetry is streamlining observability in distributed systems and is expected to solve the instrumentation problem in software development within the next 2-3 years. However, data volume is a barrier that requires innovation in data processing and storage architectures.
#DistributedTracing #Observability #OpenTelemetry #softcorpremium
Amazon CloudWatch Logs announces new Log Insights dedup command
Amazon CloudWatch Logs has introduced a new Log Insights command called \"dedup\" which enables customers to eliminate duplicate results when analyzing logs. This feature allows customers to query their logs and view only unique results based on one or more fields. The feature is supported in all AWS regions where CloudWatch Logs is available. Customers can start using CloudWatch Logs Insights to query logs sent to CloudWatch with just a few clicks in the AWS Management Console.
#CloudWatchLogs #LogInsights #AWSManagementConsole #softcorpremium
Restoring trust in the government by improving digital experience
This blog post discusses the importance of restoring trust in government by improving digital experiences and the challenges faced by government agencies in digital transformation. The post emphasizes the need for seamless digital experiences and the use of unified observability and security platforms to drive trust with citizens. The challenges faced by government agencies include lack of adequate and skilled IT resources, difficulties migrating legacy applications, and security breaches. The right technology can help agencies overcome these challenges and accelerate their digital transformation initiatives.
#digitaltransformation #governmenttrust #unifiedobservability #softcorpremium
Leveraging Splunk Dashboards for Executive Visibility | Splunk
Splunk Dashboards provide executives with real-time visibility into data from various technology silos, allowing for proactive decision-making and reducing downtime and costs. Splunk's platform uses data mining, predictive strategies, and machine learning algorithms to provide a comprehensive view of IT infrastructures and offers customer-validated improvement benchmarks to track positive impact. The real-time dashboards also provide insights on employee tenure and satisfaction, staffing availability, hospital metrics, and financial metrics. Splunk aims to build a safer and more resilient digital world and supports the SLED community in building a foundation of cyber resilience.
#SplunkDashboard #RealTimeInsights #CyberResilience #softcorpremium