💡
Attention readers! We want to let you know that the summaries in this newsletter are generated using cutting-edge generative AI technology. However, we understand the importance of accuracy and quality content, so our team of expert editors manually reviews each summary before it's published. If you feel the quality of a particular summary does not meet your expectations, please leave a comment in the Member Discussion section below. We will rectify it as soon as humanly possible!
Deep dive into 2022 State of DevOps Report on documentation | Google Cloud Blog
Google Cloud's DevOps Research and Assessment team has found a clear link between documentation quality and organizational performance, with good technical practices and documentation significantly increasing the likelihood of meeting performance and profitability goals. The team used a set of eight metrics to measure documentation quality and found that it drives the implementation of every technical practice studied, with above-average documentation quality significantly amplifying the lift to organizational performance. The team provides guidance for improving documentation quality and invites participation in the 2023 Accelerate State of DevOps survey.
#DevOpsResearch #DocumentationQuality #OrganizationalPerformance #softcorpremium
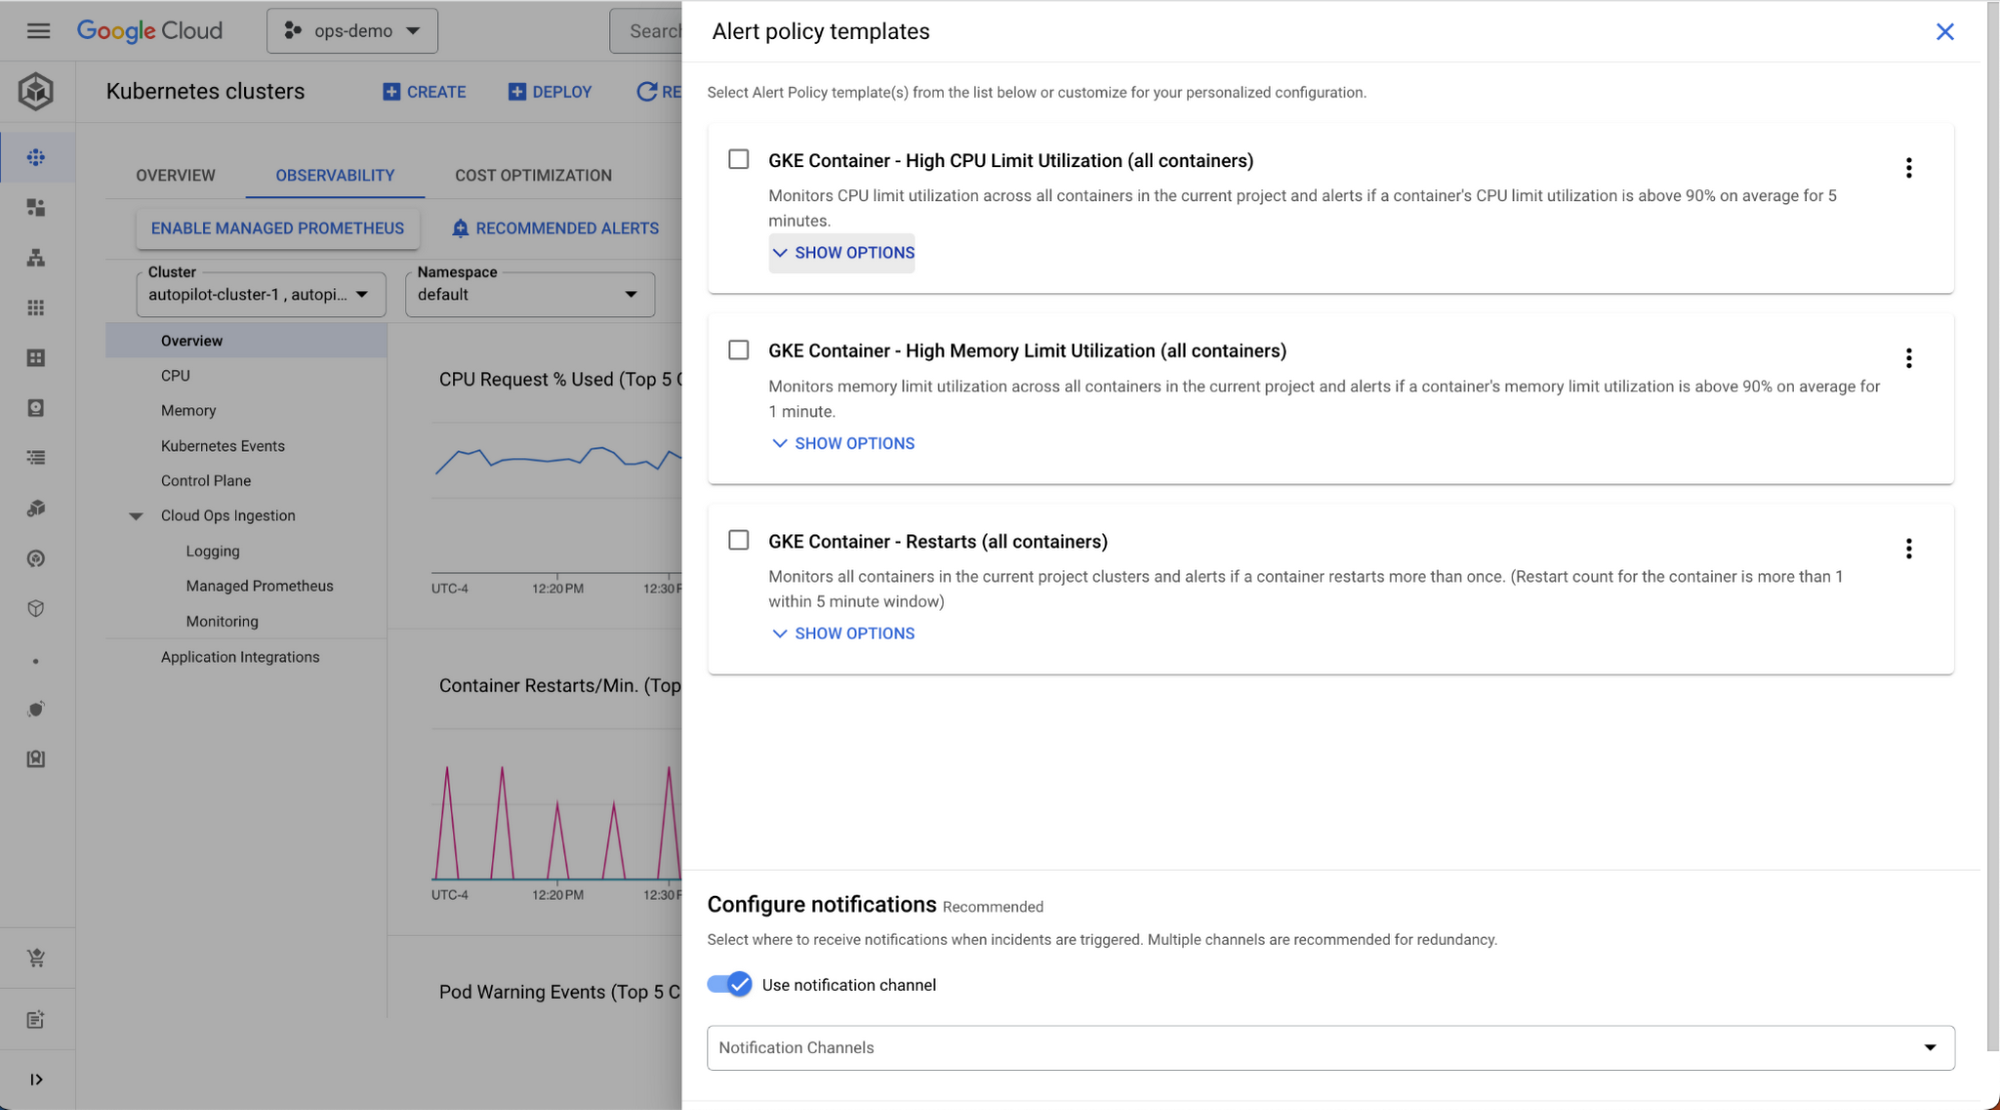
What’s new in Google Cloud Monitoring in Q2 2023 | Google Cloud Blog
Google Cloud Monitoring has launched new capabilities to detect, troubleshoot, and remediate issues with infrastructure and applications. The new features include improved visualization and troubleshooting tools, shareable dashboards, an incident widget, expanded blackbox monitoring with uptime checks, improvements in alerting, and simplified signal collection. The updates allow for easier exploration of telemetry and improved consistency in interfaces, making it easier to understand the data provided. Google Cloud Monitoring also offers recommendations for monitoring top Google Cloud services and snooze alerts to reduce noise during planned maintenance or outages.
#GoogleCloudMonitoring #InfrastructureMonitoring #ApplicationMonitoring #softcorpremium
The Rise of Open Standards in Observability: Highlights from KubeCon | Logz.io
Open standards and open specifications have become integral drivers of compatibility, collaboration, and convergence in the observability domain, allowing developers and organizations to build upon existing solutions and fostering the growth of vibrant ecosystems without vendor-locking. Key updates from KubeCon include the formation of a new CNCF working group for a query language standard for observability, the standardization of the Prometheus Remote-Write protocol, the sunset of OpenCensus in favor of OpenTelemetry, the merge of Elastic Common Schema with OpenTelemetry, and progress towards stabilizing logs in OpenTelemetry. These updates showcase the increasing significance of open standards and open specifications in the observability domain and highlight the real power of open source collaboration and standardization.
#OpenStandards #ObservabilityStandardization #OpenSourceCollaboration #softcorpremium
Monitoring CPU/RAM/disk metrics with OpenTelemetry and Uptrace | by Uptrace | Jun, 2023 | Towards Dev
The post describes how to monitor CPU, RAM, and disk metrics with OpenTelemetry and Uptrace. OpenTelemetry is an open-source observability framework that provides a standardized way to capture and transmit metrics, traces, and logs from various software components in a distributed system. Uptrace is an open-source APM tool that supports distributed tracing, metrics, and logs, and it uses OpenTelemetry to collect data and ClickHouse database to store it. The post also explains how to export the data from Collector to Uptrace using the OTLP exporter and passing the DSN in headers, and how to monitor CPU usage and filesystem usage metrics.
#OpenTelemetry #Uptrace #ClickHouse #softcorpremium
Generative AI - Mastering the Language Model Parameters for Better Outputs | by Sascha Heyer | Google Cloud - Community | Jun, 2023 | Medium
Large language models rely on parameters to control their behavior. Parameters such as temperature, token limit, top-k, and top-p play a crucial role in guiding the model's creativity, length of response, and choice of words. Adjusting these parameters can lead to more diverse or more predictable outputs. This article explains each parameter with relatable examples and emphasizes the need for practice and experimentation to master them.
#LanguageModeling #ModelParameters #NLPExperimentation #softcorpremium
GA: Application Insights Distributed tracing support for Java Function Apps | Azure updates | Microsoft Azure
Distributed tracing and Application Performance Management (APM) using OpenTelemetry-based tracing is now available for Java Apps on Azure Functions, allowing for greater visibility and data collection. The Application Insights Java agent collects data on dependencies, logs, and metrics from libraries and Azure SDKs to provide a more complete view of end-to-end transactions. The latest version includes significant improvements in cold start, interop with Application Insights Classic SDK, and a Java profiler preview.
#OpenTelemetry #ApplicationPerformanceManagement #JavaAppsOnAzureFunctions #softcorpremium
Datadog Announces Annual DASH Conference Set for San Francisco in August | Datadog
Datadog, a cloud monitoring and security platform, has announced the details of its annual conference, DASH, which will take place on August 2nd and 3rd in San Francisco. The event will feature keynote presentations from Datadog executives and over fifty sessions from engineers at companies such as Google and AWS, as well as twenty advanced workshops. Attendees will also have the opportunity to engage with technology and service providers like Google, AWS, and Red Hat. The conference aims to bring together thought leaders and experts to discuss how to build and scale the next generation of applications, infrastructure, security, and technical teams.
#DatadogDASH #cloudmonitoring #nextgenerationtech #softcorpremium
Simulating Kubernetes-workload AZ failures with AWS Fault Injection Simulator | AWS Architecture Blog
The AWS Architecture Blog discusses the use of AWS Fault Injection Simulator (FIS) to test the resilience of Kubernetes workloads during infrastructure failures like an entire Availability Zone (AZ) becoming unavailable. The article provides step-by-step instructions for creating and deploying a sample microservice, creating an IAM role, and creating an FIS experiment template to test different autoscaling tools' performance in Kubernetes. The experiment shows that Karpenter performs better and recovers quicker than Cluster Autoscaler in network disruption situations, highlighting its effectiveness as an autoscaler for maintaining high availability. The article emphasizes the importance of simulating failures in a controlled environment to identify and address issues before they occur in production.
#AWSFaultInjectionSimulator #KubernetesResilienceTesting #HighAvailabilityAutoscaling #softcorpremium
How to deliver frictionless customer experiences this Black Friday
Retailers must prepare for Black Friday by offering omnichannel experiences and investing in last-mile services to meet consumer demands. However, peak loads during Black Friday can expose weaknesses in digital infrastructure, making application security and observability crucial. Dynatrace offers a platform that combines observability, application security, and automation to help retailers confidently navigate their complex digital ecosystems and achieve successful outcomes. The platform offers real-time insights, automation, and contextual analysis to optimize inventory, reduce cyber risk, and ensure resilient performance across any business process.
#BlackFridayPrep #OmnichannelRetail #DigitalPerformanceOptimization #softcorpremium
Grafana 10 release: New panels, Grafana as code updates, data correlations, and more | Grafana Labs
Grafana Labs has released Grafana 10, offering new features and capabilities for data analysis, collaboration, and dashboard creation. These include new panels, data correlations, and enhanced visualization, dashboard sharing, and security features. Grafana Cloud offers a free account, and users can either upgrade their instance or download the latest version. The platform aims to empower users to make the most of their data through improved data retrieval, navigation, and management. Additionally, Grafana is introducing new offerings, such as Grafana Cloud k6 for performance testing, and hosting events for the open-source observability community.
#Grafana10 #DataVisualization #ObservabilityCommunity #softcorpremium