💡
Attention readers! We want to let you know that the summaries in this newsletter are generated using cutting-edge generative AI technology. However, we understand the importance of accuracy and quality content, so our team of expert editors manually reviews each summary before it's published. If you feel the quality of a particular summary does not meet your expectations, please leave a comment in the Member Discussion section below. We will rectify it as soon as humanly possible!
5 Tips for Faster Troubleshooting to Reduce MTTR | Logz.io
Organizations are facing challenges in reducing the Mean Time to Resolution (MTTR) for application and system issues. A survey showed that over 75% of respondents have an MTTR that exceeds multiple hours and only 14% are satisfied with their current MTTR. To address this, organizations can implement five essential tips for faster troubleshooting: 1) Gain centralized visibility into application performance, 2) Streamline troubleshooting in Kubernetes environments, 3) Automate log analysis for quicker insights, 4) Correlate deployments with change analysis to identify performance impacts, and 5) Create an error tracking dashboard to track and analyze error data over time. By implementing these strategies, organizations can reduce MTTR, minimize downtime, and improve system performance. Logz.io offers an observability platform that can help organizations in achieving these goals.
#MTTRchallenges #fastertroubleshooting #improvesystemperformance #softcorpremium
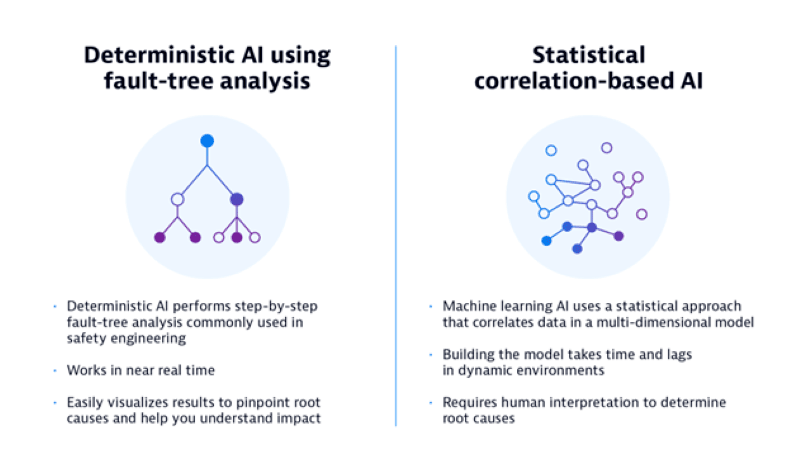
What is causal AI? Why this deterministic AI approach is critical
Causal AI, also known as deterministic AI, is revolutionizing the way organizations understand the causes and effects of events or behaviors. Unlike traditional correlation-based machine learning, which only predicts probabilities, causal AI uses fault-tree analysis to determine the precise root cause of issues. This systematic approach allows for automatic anomaly detection, root-cause analysis, security risk ranking, and business impact assessment. Unlike correlation-based AI, which relies on statistics and assumptions, causal AI provides fact-based and explainable analyses. It is not prone to bias issues and can adapt to new situations.
#CausalAI #DataDrivenDecisions #ImproveDevOps #softcorpremium
Simplified Observability & Faster Time-to-Insights with Logz.io Service Overview
Logz.io has introduced Service Overview, a tool that unifies telemetry data and insights across infrastructure and applications into a single interface. It aims to provide simplified observability, faster time-to-insights, and observability consolidation. The goal is to help organizations prevent digital friction and deliver performant applications by easily spotting performance trends and identifying the root causes of production issues. The tool requires minimal configuration and can be used to monitor microservices by collecting log, metric, and trace data using the Telemetry Collector. Service Overview provides a broad overview of service performance and allows users to drill down into specific services and transactions for deeper analysis. It also integrates with Logz.io's Distributed Tracing product for detailed analysis of application requests. Users can try Service Overview by deploying the Telemetry Collector on their Kubernetes cluster and accessing the tool within the Logz.io platform. No additional configuration is needed for data visualizations.
#observabilitysimplified #telemetrytool #softcorpremium
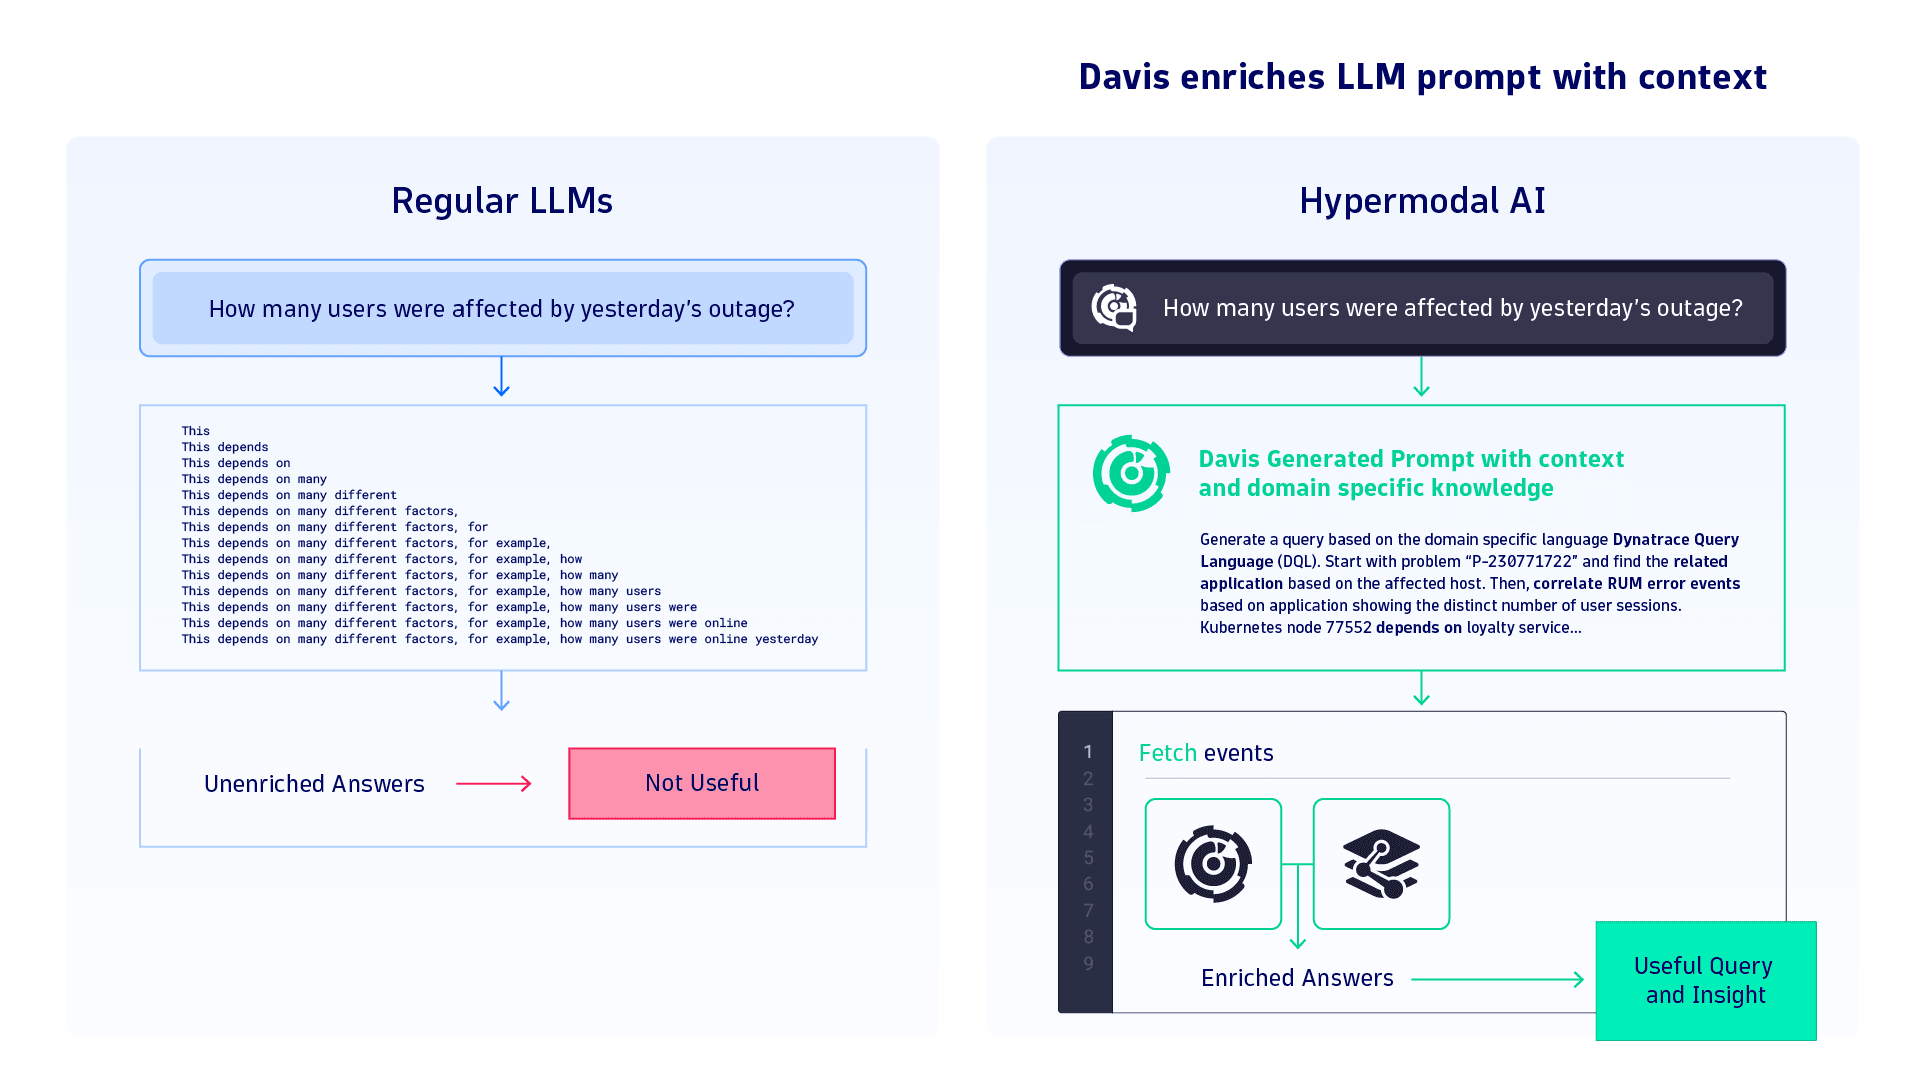
Dynatrace expands Davis AI with Davis CoPilot and hypermodal AI
Dynatrace has expanded its Davis® AI with the introduction of Davis CoPilot™, making it the first hypermodal AI platform in the industry. Hypermodal AI combines predictive AI, causal AI, and generative AI to enhance productivity across operations, security, development, and business teams. Davis CoPilot enables users to effortlessly create queries, data dashboards, and data notebooks using natural language and provides coding suggestions for workflow automation. Davis CoPilot, will be available later in 2023!
#HypermodalAI #dynatrace #observability #softcorpremium
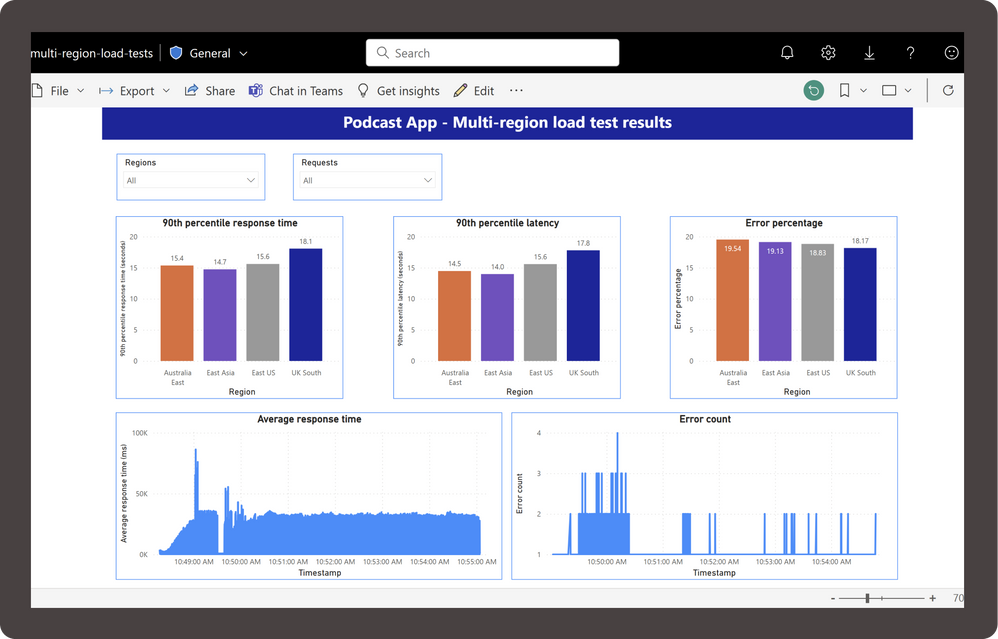
Multi-region load tests using Azure Load Testing
Azure Load Testing is a fully managed service that allows users to generate high scale load and gain insights into the performance of their applications. This blog post explains how to use Azure Load Testing to analyze client-side performance metrics for global applications. It provides a step-by-step guide on setting up and running a multi-region load test using automation options. The post also includes a Python script and PowerBI template for visualizing the test results. Overall, the blog post aims to help users ensure that users from different regions do not experience longer response times in their applications.
#AzureLoadTesting #PerformanceAnalysis #MultiRegionLoadTest #softcorpremium
Azure Monitor: Gain Observability On Your DHCP Server - Microsoft Community Hub
Microsoft Azure has expanded its observability offerings with Azure Monitor, allowing customers to gain visibility over DHCP servers. By ingesting DHCP logs into Azure Monitor's Log Analytics workspace and visualizing the data through Azure Workbooks, users can easily search for DHCP events and create a dashboard to monitor them. Microsoft has provided a script to simplify the process of ingesting logs and creating the necessary tables and transformations. Additionally, a ready-to-use workbook template is available, featuring tiles with aggregated information on events and a search box for log entries. This solution is applicable to both Azure virtual machines and Arc-Enabled servers.
#AzureMonitor #DHCPMonitoring #LogAnalytics #softcorpremium
AppDynamics Cloud is now Cloud Native Application Observability, powered by the Cisco Full-Stack Observability Platform - Application Performance Monitoring Blog | AppDynamics
Cisco has renamed AppDynamics Cloud to Cloud Native Application Observability and launched the Cisco Full-Stack Observability (FSO) Platform. Cloud Native Application Observability is now Cisco's premier application performance management solution for observing, securing, and optimizing cloud native architectures. It offers core capabilities such as cross-domain visibility, correlated metrics, events, logs, traces, and AI/ML-driven insights. The platform is extensible and customizable, allowing organizations to address specific use cases and add modular solutions through the Cisco FSO Exchange. Cisco also announced support for Google Cloud Platform and plans to expand its services.
#CiscoFSO #CloudNativeObservability #AppPerformance #softcorpremium
JetBrains ships Qodana static code analysis tool | InfoWorld
JetBrains has launched Qodana, a code quality monitoring platform that integrates with its IDEs and uses static code analysis to enforce quality guidelines. Qodana offers an additional quality control layer at the CI/CD level and provides results directly to IDEs. It includes features such as vulnerability checking, automatic fixes for certain issues, and coverage for multiple programming languages. Qodana can be used in JetBrains IDEs and can also integrate with third-party inspection tools.
#codequality #staticcodeanalysis #Qodana #softcorpremium
Amazon CloudWatch announces ML backed Logs Insights pattern query command
Amazon CloudWatch has introduced a new command called \"pattern\" in Logs Insights, which uses machine learning algorithms to help customers identify trends and patterns in their logs. This command aggregates related logs, summarizes log lines, and allows for easy visualization of data. It helps customers quickly identify emerging trends, monitor errors, and increase cost visibility. Logs Insights is a log analytics service that allows for exploration, analysis, and visualization of logs to troubleshoot operational problems. The pattern command is now available in all AWS regions where CloudWatch Logs is available.
#LogsInsights #CloudWatchLogs #softcorpremium
Real user monitoring in Grafana Cloud: Get frontend error tracking, faster root cause analysis, and more | Grafana Labs
Grafana has announced the general availability of Grafana Cloud Frontend Observability, a hosted service for real user monitoring (RUM) that provides insights into the end user experience of web applications. This offering allows users to monitor frontend health, identify and resolve frontend errors, investigate frontend issues with end-to-end visibility, and query and visualize frontend telemetry in Grafana. It helps track frontend performance metrics and provides actionable insights for troubleshooting and improving user experience. Frontend Observability is available to all Grafana Cloud users, including those in the free tier, and is priced at $0.30 per 1k sessions starting from January 1, 2024.
#GrafanaCloudFrontendObservability #RealUserMonitoring #FrontendPerformanceMetrics #softcorpremium
Influencer Analytics with Vertex AI PaLM APIs & Langchain | by Ravi Manjunatha | Google Cloud - Community | Jul, 2023 | Medium
This article discusses how the use of Language Model (LLM) technology combined with Vertex AI and Langchain APIs can simplify the process of analyzing influencers' opinions on social media platforms. The article provides a step-by-step guide on how to import the necessary libraries, load and split videos, store and index documents, create a chain to answer questions, define functions, integrate with Gradio, and more. The article also mentions the potential integration of social media reviews and balance sheets to gain a comprehensive view of organizations and their products.
#LanguageModelTechnology #SocialMediaAnalytics #InfluencerOpinions #softcorpremium
DevOps automation: From event- to answer-driven automation
DevOps automation is evolving from event-driven to answer-driven automation with the emergence of causal AI. This new approach goes beyond passive observations and analyzes context to deliver precise and proactive actions. Answer-driven automation empowers DevOps teams to address complex issues in real time, optimize workflows, and enhance operational efficiency. It has applications in various areas, such as online shopping, threat detection and response, progressive delivery, intelligent incident management, and change impact analysis. By combining observability data, causal AI insights, and answer-driven automation, organizations can achieve more efficient and secure software delivery.
#DevOpsAutomation #CausalAI #AnswerDrivenAutomation #softcorpremium