💡
Attention readers! We want to let you know that the summaries in this newsletter are generated using cutting-edge generative AI technology. However, we understand the importance of accuracy and quality content, so our team of expert editors manually reviews each summary before it's published. If you feel the quality of a particular summary does not meet your expectations, please leave a comment in the Member Discussion section below. We will rectify it as soon as humanly possible!
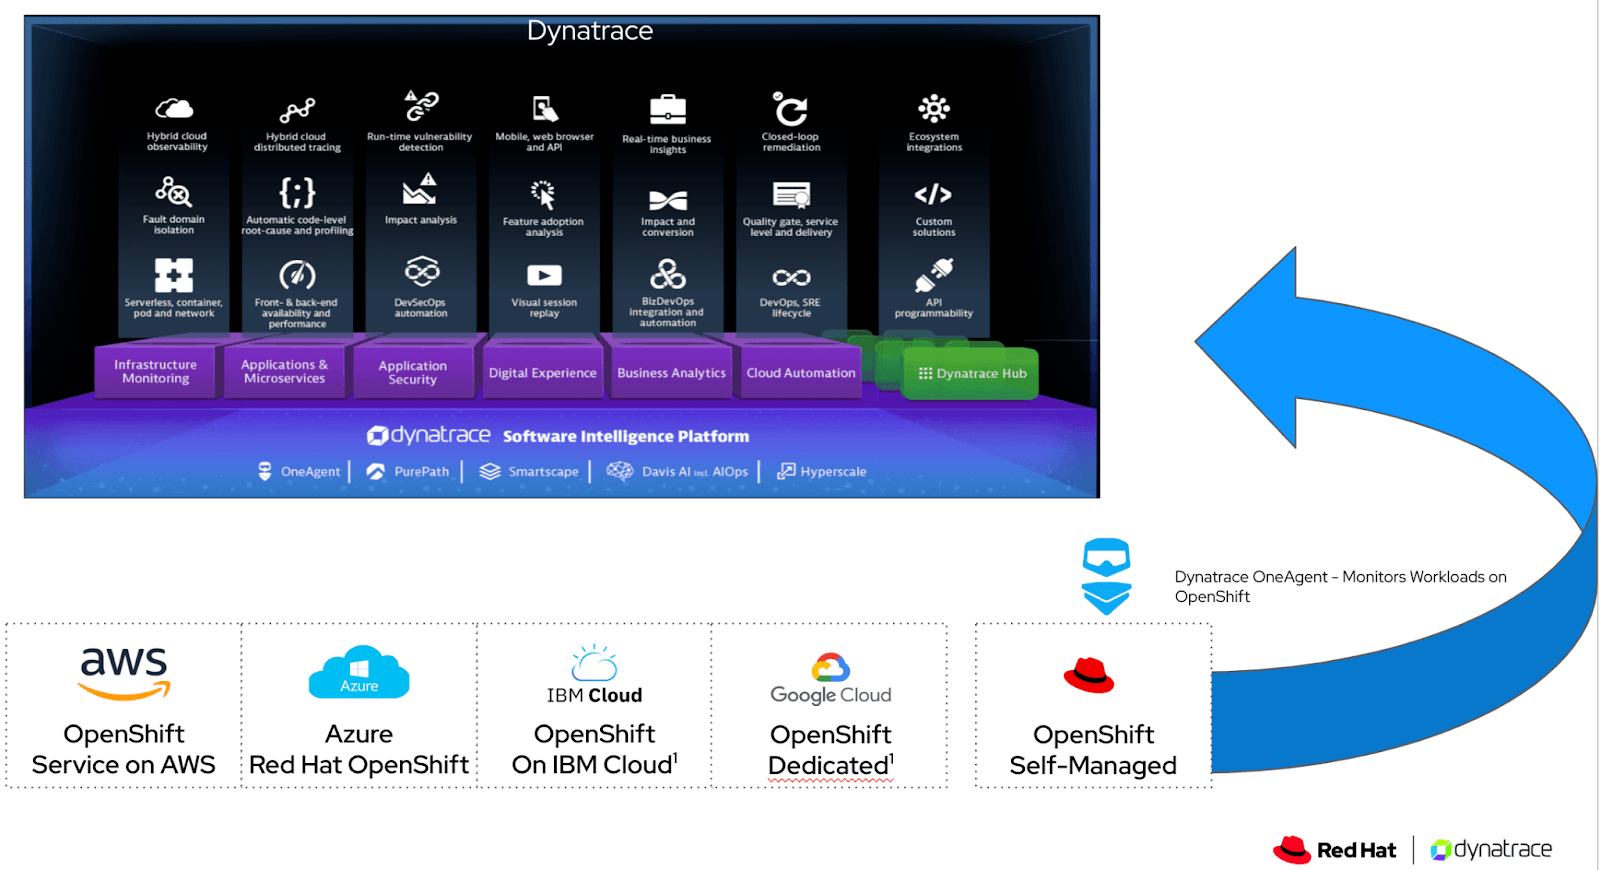
Dynatrace observability is now available for Red Hat OpenShift on the IBM® Power® architecture
IBM and Dynatrace have partnered to bring the Dynatrace Operator, a tool for deployment and management of observability in Kubernetes and Red Hat OpenShift clusters, to Red Hat OpenShift on IBM Power architecture. This collaboration aims to accelerate modernization to hybrid cloud and increase operational efficiencies by providing greater visibility across the full stack. Dynatrace's monitoring capabilities, such as infrastructure health monitoring, full stack observability, and intelligent root cause analysis, will be integrated with Red Hat OpenShift on IBM Power servers. The Dynatrace Operator automates the deployment and configuration of Dynatrace components within Kubernetes environments, simplifying the setup and maintenance of observability.
#IBMxDynatrace #observabilitytools #hybridcloudmodernization #softcorpremium
Announcing Kubernetes 360 Updates for Deeper Visibility into Kubernetes Performance | Logz.io
Logz.io has announced new feature updates for its Kubernetes 360 platform to enhance visibility and troubleshooting capabilities for Kubernetes environments. The updates include the ability to select specific deployments with filters, a Metrics tab to analyze behavior over time, improved log search and time range functions, and the option to view data from multiple clusters simultaneously. These updates aim to address the challenges and complexities associated with Kubernetes and provide a unified observability experience.
#Kubernetes360Platform #ObservabilityUpdates #Logzio #softcorpremium
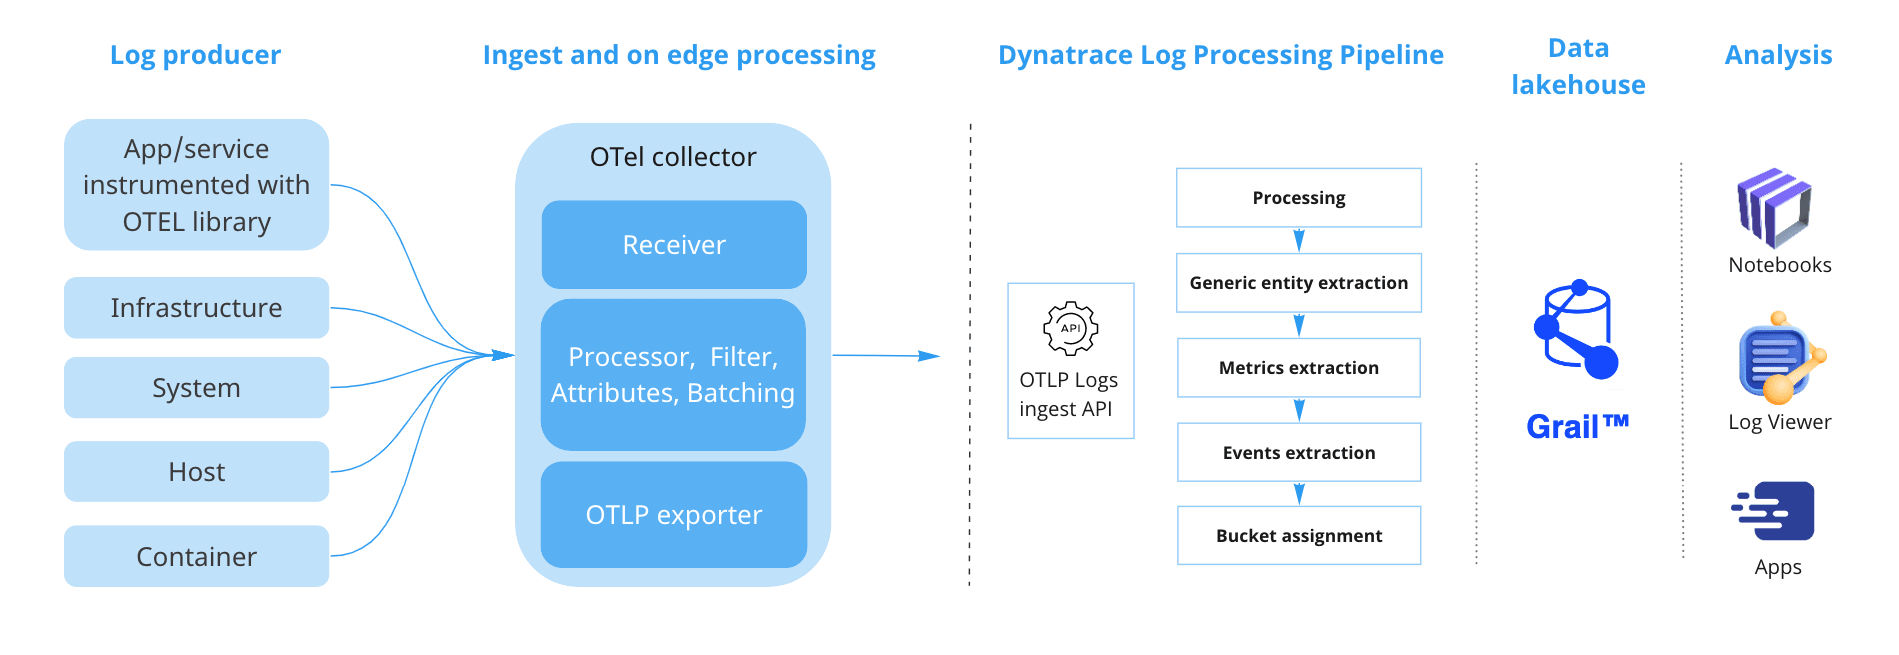
OpenTelemetry logs in Grail unlock full observability
Dynatrace now offers native support for OpenTelemetry logs, allowing users to collect all their observability data in one platform. This complements Dynatrace's existing support for collecting traces and metrics via OpenTelemetry Protocol. By supporting OpenTelemetry logs, Dynatrace enables unified observability and eliminates the need for separate instrumentation and integration efforts. This support also allows for the utilization of the Grail data lakehouse and its analytics engine. The integration of logs with traces and metrics provides a holistic overview of observability signals and allows for the linking of traces with root-cause information in logs. The native support for OpenTelemetry logs is particularly beneficial for enterprises with diverse technical architectures. Users can ingest log data into Dynatrace through the OpenTelemetry Logs Ingest API, making it accessible for analysis and monitoring. Dynatrace's support for OpenTelemetry logs is available in version 1.270.
#DynatraceLogs #ObservabilitySimplified #UnifiedObservability #softcorpremium
Leveraging Azure PostgreSQL Multi-Resource Alerts for Scalable Monitoring - A Comprehensive Guide
Azure Database for PostgreSQL Flexible Server now supports multi-resource metric alerts in Azure Monitor, which simplifies the monitoring process by allowing users to monitor multiple resources simultaneously. This feature eliminates the need for individual alerts for each resource, reducing management overhead. It also provides resource-specific notifications and uses machine learning to establish custom thresholds. The process of setting up multi-resource metric alerts involves selecting the relevant resources, choosing metrics, setting conditions, and defining alert details. The pricing for metric alert rules depends on the number of metric timeseries monitored. Overall, this functionality streamlines the management of metric alerts on a larger scale and improves monitoring efficiency.
#AzureMonitoring #MetricAlerts #EfficientMonitoring #softcorpremium
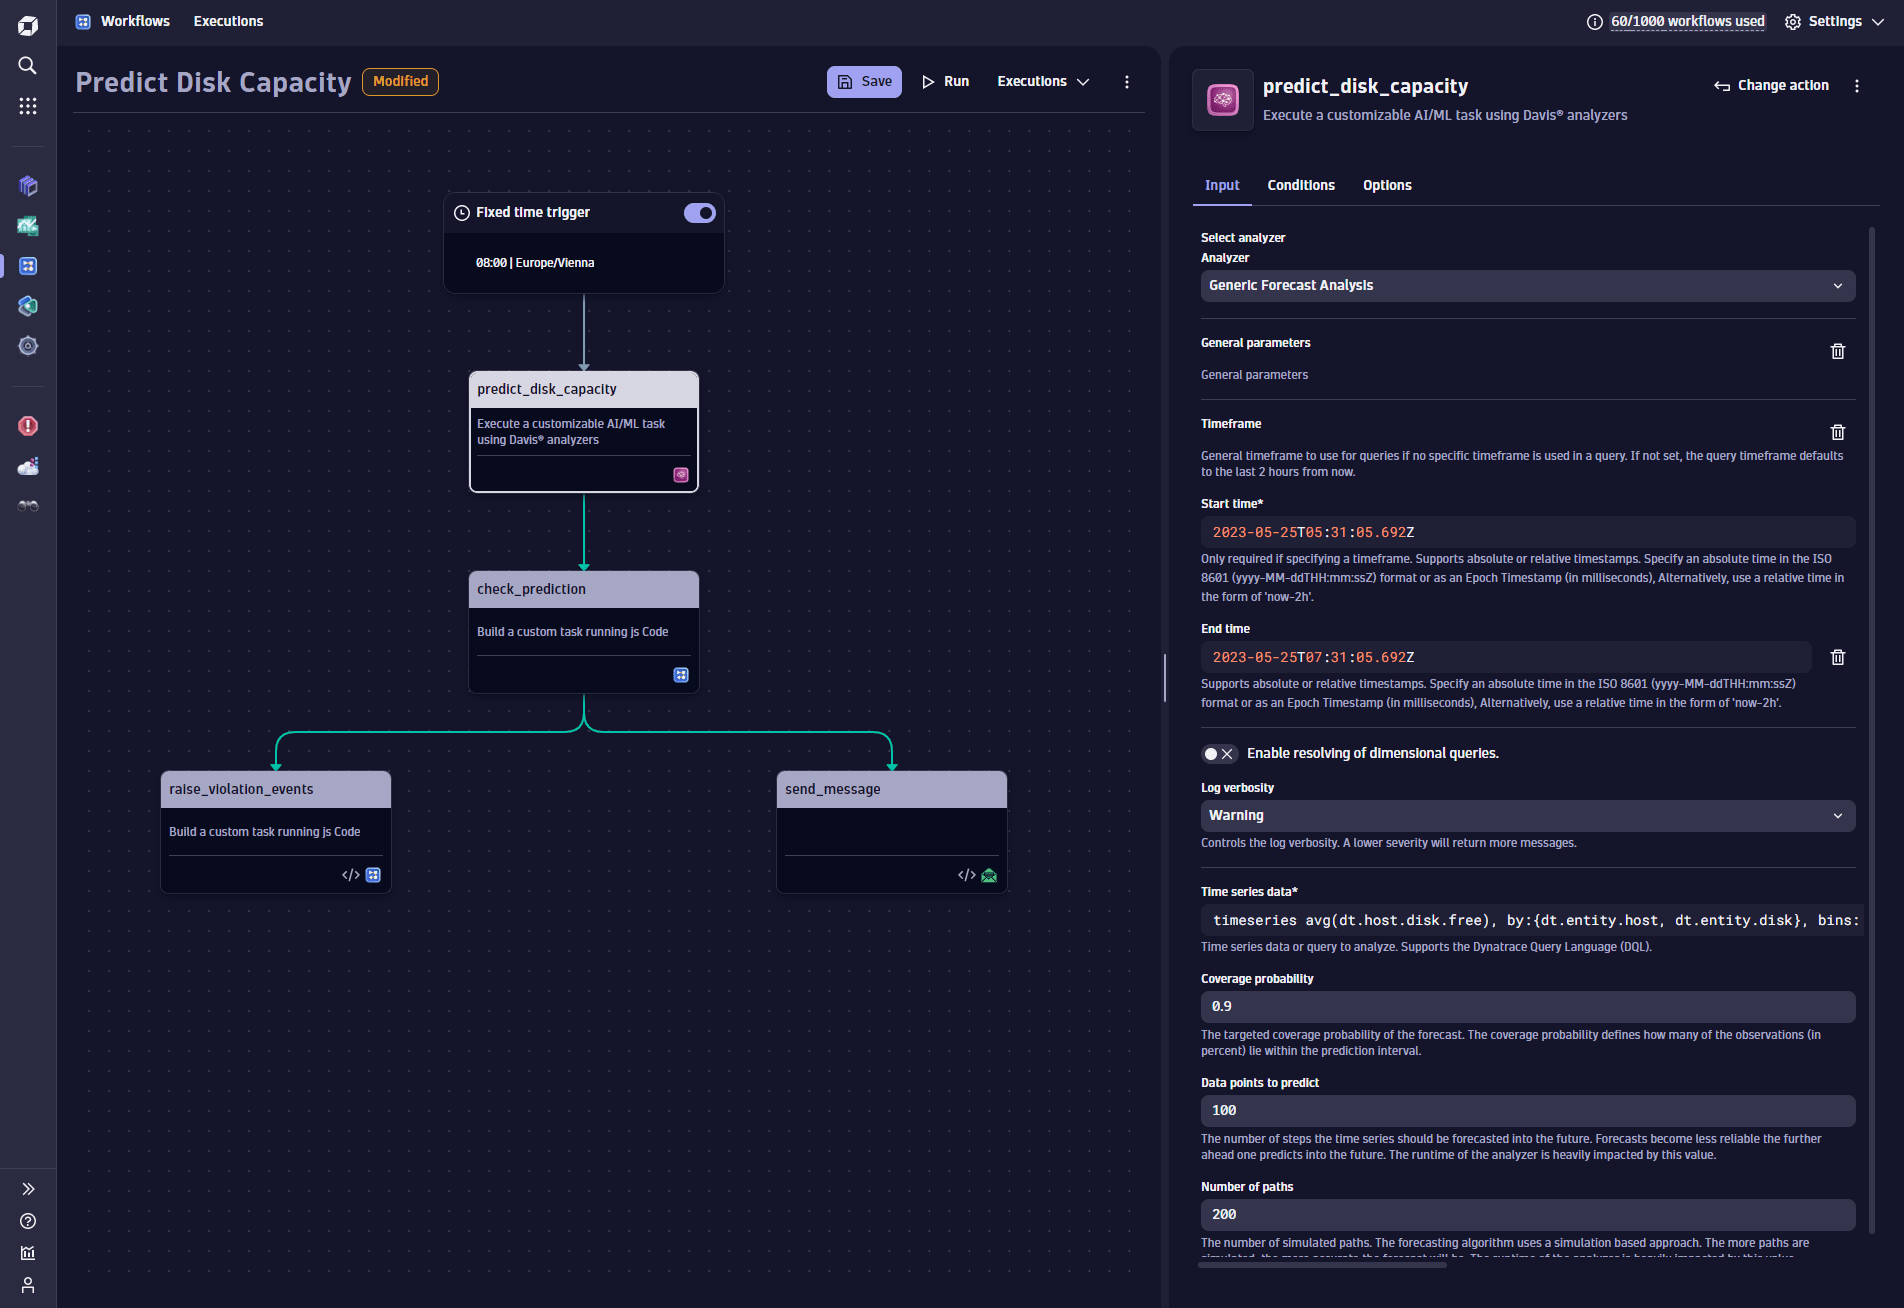
Automate predictive capacity management with Davis AI for Workflows
This blog post discusses how Dynatrace Grail and Davis AI can be used for predictive capacity management. The process involves using Dynatrace Notebooks to explore capacity indicators, triggering forecast reporting at regular intervals, evaluating the forecast results, and triggering remediation actions for predicted capacity shortages. The combination of Davis AI forecasts with Dynatrace AutomationEngine and Grail allows for anticipative management of capacity and the ability to react to detected shortages flexibly.
#DynatraceGrail #DavisAI #capacitymanagement #softcorpremium
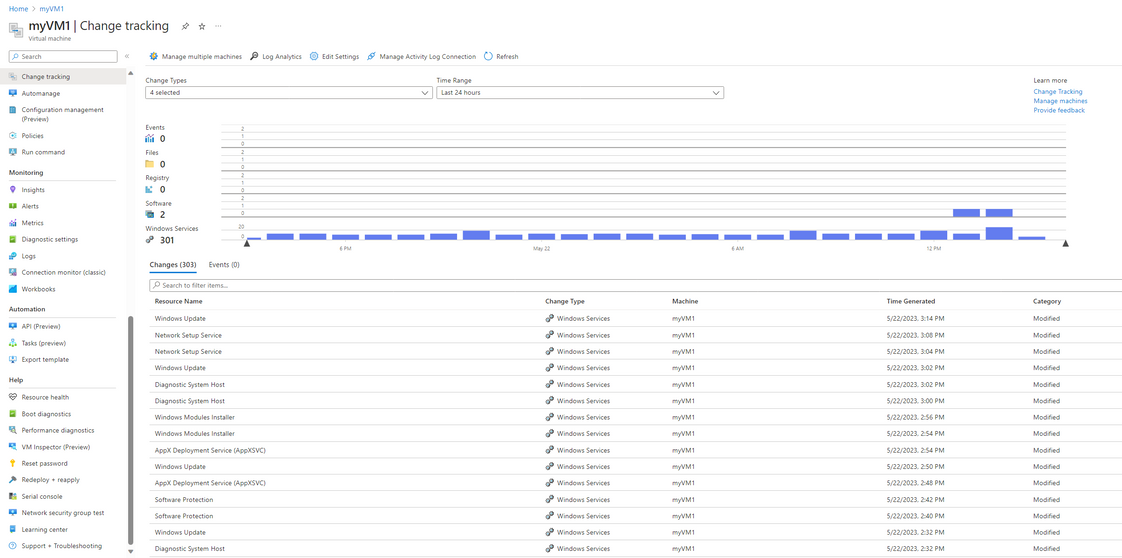
How to identify a stopped service in a Windows VM using Log Analytics Workspace - Microsoft Community Hub
This post provides instructions on how to monitor the status of a Windows service running on a Windows virtual machine (VM) on Azure using Log Analytics query. It explains how to enable and use the Windows Admin Center tool to monitor and perform operations on the Windows services from the Azure Portal. Additionally, it outlines how to monitor the status of Windows services using the Azure Monitor Agent extension installed on the Azure VM and provides a sample Log Analytics query for monitoring stopped services. The post also mentions creating an alert rule to receive email notifications when a Windows service's state changes to \"Stopped.\"
#WindowsServiceMonitoring #AzureLogAnalytics #WindowsAdminCenter #softcorpremium
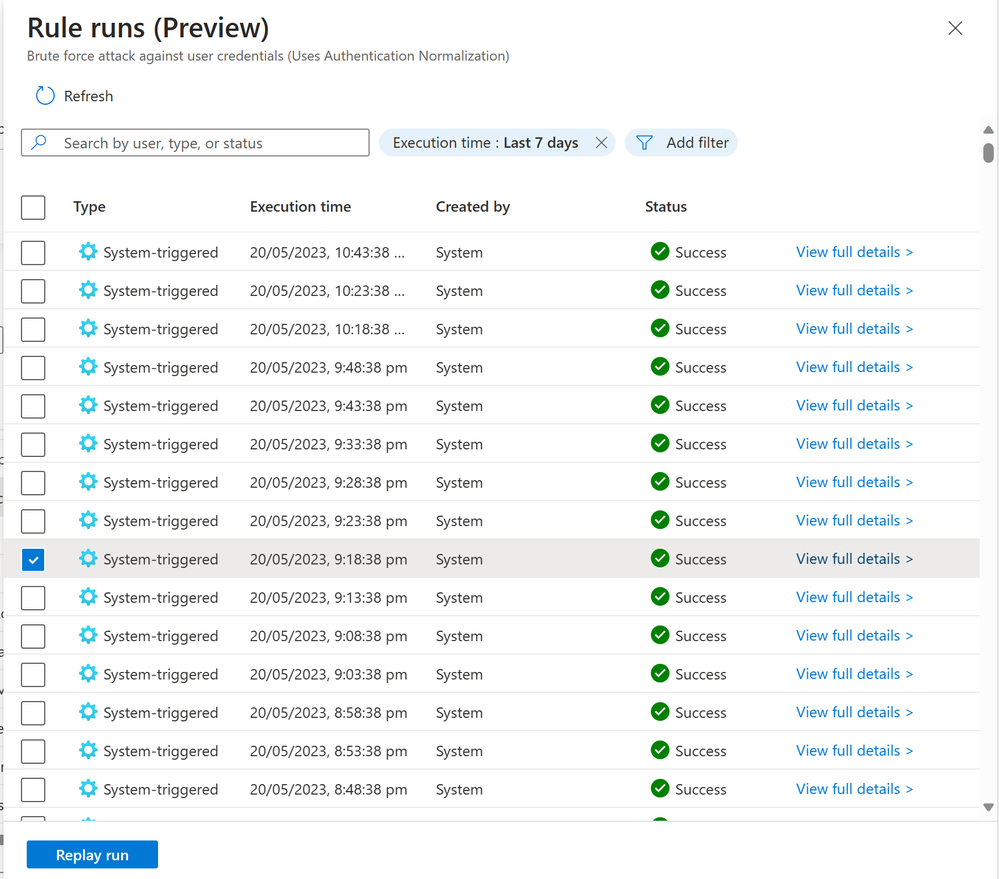
What’s new: Monitor and optimize the execution of your scheduled analytics rules - Microsoft Community Hub
Microsoft Sentinel has introduced new capabilities for Analytics Health Monitoring, allowing organizations to monitor the health and integrity of their analytics rules. This includes insights into the success or failure of rule executions and the ability to re-run failed executions for validation. The Execution Management feature also provides rule insights and the ability to re-run scheduled rules on-demand, enabling testing, troubleshooting, and optimization of rule configurations. This flexibility enhances security operations, incident response, and overall detection and response capabilities. Users can view analytic rule insights and re-run rules from the Microsoft Sentinel navigation menu. The option to manually re-run analytics rules is beneficial for rule refinement and tuning, testing and validation, incident investigation, and compliance and auditing purposes.
#AnalyticsHealthMonitoring #ExecutionManagement #MicrosoftSentinel #softcorpremium
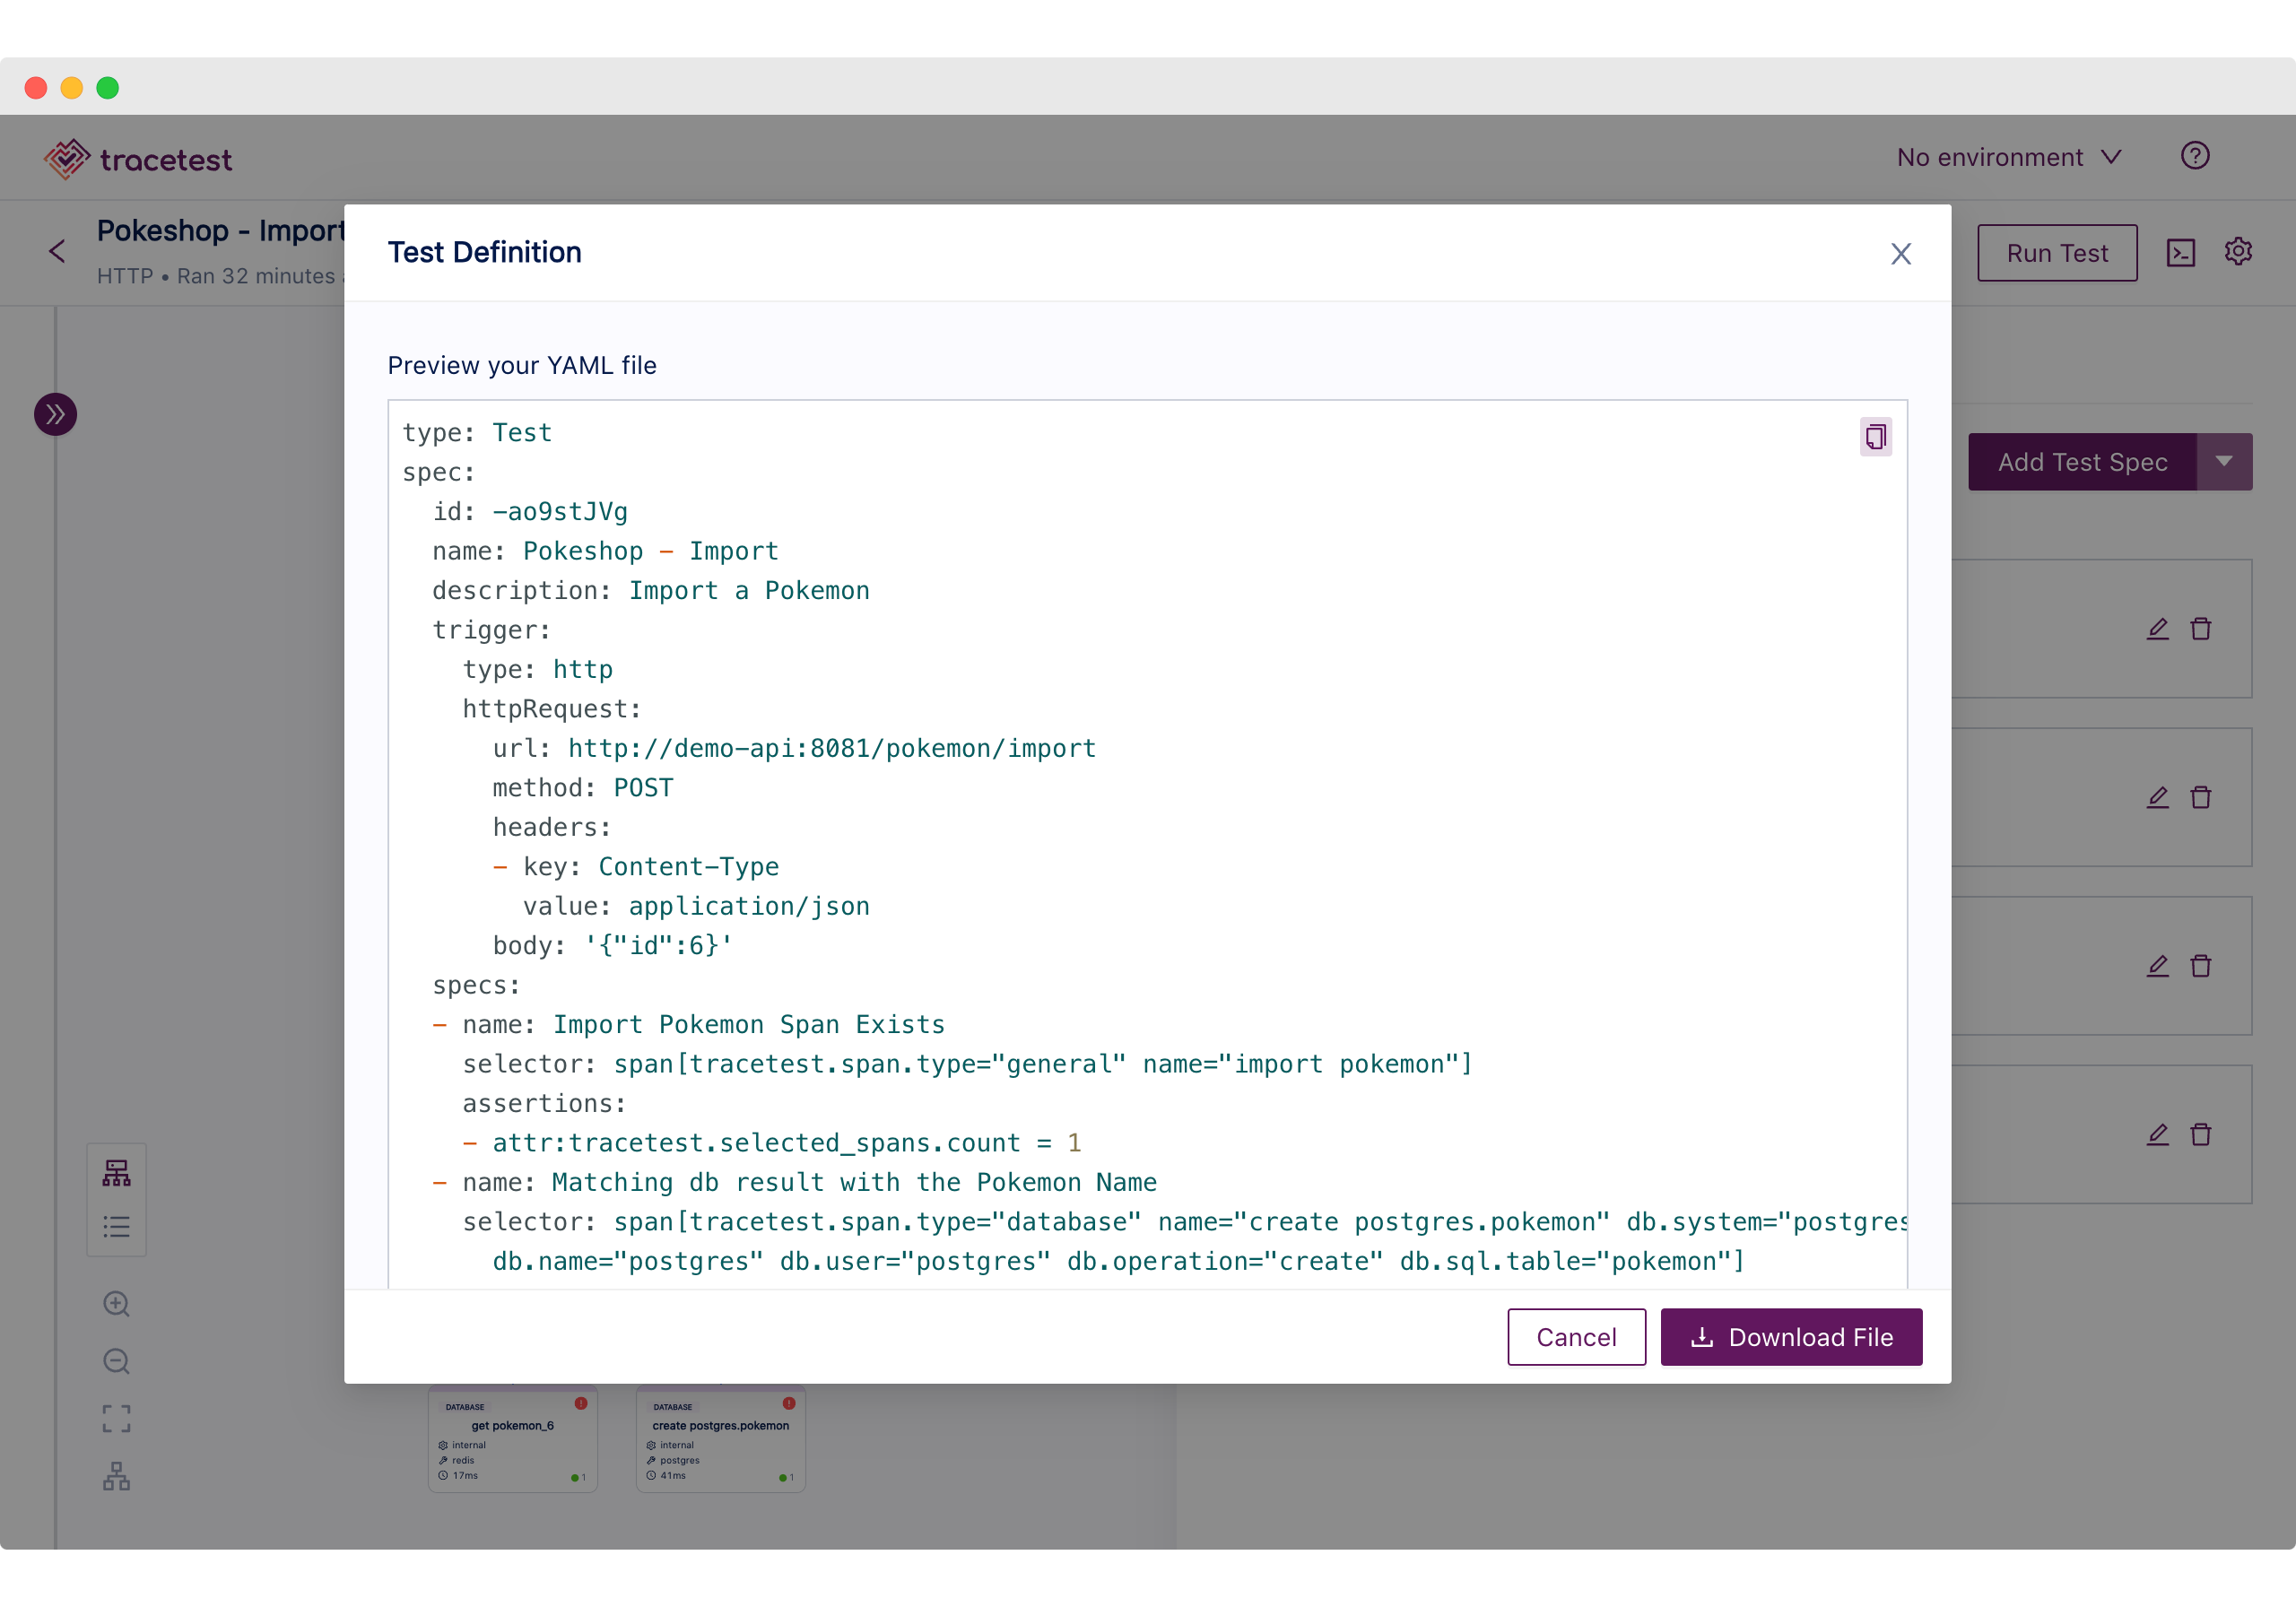
Monitoring and Testing Cloud Native APIs with Grafana
This article discusses the use of Grafana, Tempo, and OpenTelemetry Collector for monitoring and testing cloud native APIs. It provides a tutorial on setting up and using Docker Compose to run these tools for effective monitoring and testing of APIs. The article also covers trace validation, integration testing, and analyzing test results. Tracetest, an open-source trace-based testing tool, is mentioned as a way to define tests and assertions for microservices using distributed tracing. The summary also mentions the availability of additional resources and support through documentation, a Discord community, and scheduling a demo.
#cloudnative #APImonitoring #distributedtracing #softcorpremium
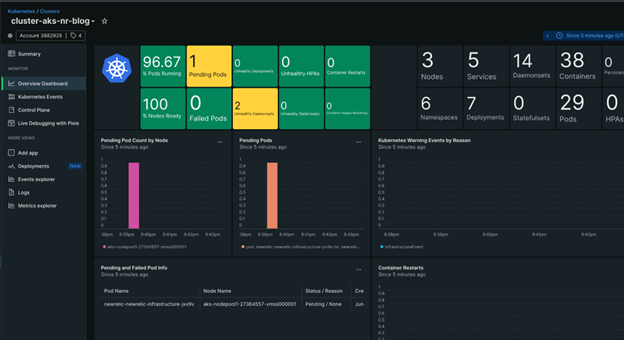
Leveraging New Relic for instrumentation of Windows Container on Azure Kubernetes Service - Microsoft Community Hub
This blog post discusses the challenges of monitoring Windows containers in a Kubernetes environment and how New Relic's observability platform can help overcome these challenges. New Relic offers container-centric visibility, automatic instrumentation, performance monitoring, scalability and alerting, visualization and analytics. The post also provides instructions on how to install New Relic Kubernetes integration for Windows. Overall, New Relic's capabilities enable effective monitoring and optimization of Windows containerized applications in Kubernetes deployments.
#WindowsContainerMonitoring #NewRelicKubernetesIntegration #ContainerVisibility #softcorpremium
Fedora Wants to Add Telemetry To its Linux Distribution
The proposal to add opt-out telemetry to Fedora's Linux distribution has caused controversy within the community. The proposal aims to collect data while prioritizing privacy, but some members of the community have raised concerns. Red Hat, the company behind Fedora, argues that the data collection is important for improving the operating system's default experience and understanding user behavior. Similar data collection practices are already implemented in Ubuntu, with users able to enable or disable telemetry during installation. The controversy surrounding the proposal is amplified by existing grievances with Red Hat, such as their decision to restrict access to their RHEL source code. The article is written by M.Hanny Sabbagh, a computer science graduate and open source software developer who promotes open source. The website, FOSS Post, provides free content and encourages support through donations and joining their Patreon campaign. The website requests consent to use personal data for personalized ads, content measurement, audience insights, and product development. Various advertising services mentioned in the article use cookies and other forms of storage to track user information, with different durations for storing this data. These companies have privacy policies in place and require user consent or have a legitimate interest in collecting data.
#FedoraTelemetry #OpenSourceCommunity #PrivacyConcerns #softcorpremium
Public Preview: Azure Monitor Logs improved table-level RBAC | Azure updates | Microsoft Azure
Azure Monitor Logs now has advanced RBAC options that allow for handling sensitive logs in complex environments. The new method includes table-level access, which allows specific individuals to only read data from a specific set of tables. This method applies to both workspace-context and resource-context, and it allows for granular RBAC for custom log tables using standard Azure RBAC tools. This new method will be available alongside the legacy method that used table-specific actions.
#AzureMonitorLogs #AdvancedRBACOptions #GranularRBAC #softcorpremium
Integrating Cisco AppDynamics and Cloud Native Application Observability for unified hybrid cloud monitoring - Application Performance Monitoring Blog | AppDynamics
Cisco AppDynamics is aiming to provide a unified experience for enterprises transitioning to modern cloud native architectures. They are integrating their AppDynamics platform with advanced functionality from Cisco FSO Platform to offer complete visibility of business journeys. This includes integrating log analytics, core web vitals, and cloud/infrastructure troubleshooting. The goal is to provide a seamless workflow and reduce complexity for end users. Cisco is also focusing on integrating their observability solutions across their portfolio offerings to provide actionable insights and support customers in their digital transformations. They are committed to bringing the best of Cisco to their customers and are continuously innovating to enhance their observability solutions.
#CloudNativeJourney #SeamlessObservability #DigitalTransformation #softcorpremium
Public Preview: Ingest events from Azure Event Hubs to Azure Monitor Logs | Azure updates | Microsoft Azure
Azure Event Hubs now allows users to directly ingest data into a Log Analytics workspace. This feature is beneficial for those who already rely on message queueing mechanisms and want to ingest data into multiple destinations. Users can connect their applications to Kafka endpoint without code changes or use other methods to bring data to Event Hub. The main benefits of this feature include scalability, reliability, and the flexibility to add advanced configurations. This eliminates the need to use and maintain other components like functions, logic apps, and plugins. Azure Monitor features are also integrated into this feature.
#AzureEventHubs #LogAnalytics #DataIngestion #softcorpremium
2023 Gartner Magic Quadrant for Application Performance Monitoring and Observability
Logz.io has been named a Visionary in the 2023 Gartner Magic Quadrant for Application Performance Monitoring and Observability. They have focused on evolving their Logz.io Open 360 observability platform and introducing capabilities for Kubernetes environments and data optimization. They aim to provide customers with efficient and affordable observability solutions and will continue to introduce new powerful capabilities. Logz.io is proud of the recognition from Gartner and will strive to consistently improve their platform.
#logzio #observability #applicationperformancemonitoring #softcorpremium
Dynatrace Named a Leader and Positioned Furthest for Vision and Highest in Execution in the 2023 Gartner® Magic Quadrant™ for Application Performance Monitoring and Observability
Gartner has named Dynatrace a Leader in the 2023 Magic Quadrant for APM and Observability, recognizing its Ability to Execute and Completeness of Vision. Dynatrace's platform offers analytics and automation for unified observability and security, helping customers achieve better business outcomes. The company has also been recognized as a Customers' Choice in Gartner's Peer Insights Voice of the Customer report. Dynatrace's technology has been praised by customers for its ability to respond to incidents, improve performance, and provide meaningful data analysis.
#DynatraceAPM #GartnerMagicQuadrant2023 #CustomerChoice #softcorpremium
Public preview: Managed private endpoint for Azure Managed Grafana | Azure updates | Microsoft Azure
Microsoft has introduced a new feature called managed private endpoint for Azure Managed Grafana workspace. This feature allows customers to connect their workspace to Azure data sources within their private networks, avoiding public networks. It adds an extra layer of protection against data exfiltration and is easy to set up. The feature is currently in public preview and is compatible with various Azure data sources. Additionally, customers can also set up private links between their virtual networks and Grafana instances to keep their workspaces private.
#AzureManagedGrafanaWorkspace #ManagedPrivateEndpoint #DataSecurity #softcorpremium
Public preview: Azure Monitor application insights configurable Real User Monitoring for Java | Azure updates | Microsoft Azure
Azure Monitor Application Insights is a cloud-native application monitoring service that helps improve application performance and effectiveness by observing failures, bottlenecks, and usage patterns. The new \"browserSdkLoader\" configuration in the Azure Monitor OpenTelemetry Java Distro simplifies enabling Real User Monitoring (RUM) by automatically including a Loader Script that downloads the JavaScript SDK and collects additional client/web data. Previously, Java customers had to instrument twice, but now they only need to instrument once with the Azure Monitor OpenTelemetry Java Distro. This additional data allows for powerful user monitoring experiences and can be enabled by upgrading to the latest version of the applicationinsights-agent.jar and setting the configuration to 'true'.
#AzureMonitor #ApplicationInsights #RealUserMonitoring #softcorpremium
Packworks leverages AI to forecast future trends in stores - Back End News
Packworks, a startup in the Philippines, is using AI and machine learning to help neighborhood store owners with stock management. By analyzing transaction data, Packworks can predict future sales trends and provide insights into consumer preferences. The company also offers a business intelligence tool called Sari IQ, which allows retailers and brands to gain visibility into neighborhood store operations and make data-driven decisions. Packworks aims to optimize operations and drive growth for micro-entrepreneurs in the retail market.
#AIforRetail #DataDrivenDecisions #BusinessIntelligence #softcorpremium
Amazon GuardDuty EKS Runtime Monitoring expands operating systems and processor support
Amazon GuardDuty EKS Runtime Monitoring now supports Amazon Elastic Kubernetes Service (Amazon EKS) workloads using Bottlerocket, AWS Graviton, and AMD64 processors. The new agent version also includes performance enhancements and support for Amazon EKS 1.27 clusters. Users can automatically upgrade the security agent with automated agent management or manually upgrade it. GuardDuty EKS Runtime Monitoring continuously monitors container runtime activity to detect malicious behavior and generates security findings with detailed information. A 30-day free trial is available for those not yet using the feature.
#AmazonGuardDuty #EKSRuntimeMonitoring #ContainerSecurity #softcorpremium
Tips when migrating to Azure Monitor Agent from Log Analytics agent - Microsoft Community Hub
The Log Analytics agent will be retired on August 31, 2024, and it is recommended to migrate to Azure Monitor Agent. The Azure Monitor Agent provides benefits such as cost savings, simplified management, and enhanced security and performance. A sample design for deploying the Azure Monitor Agent is provided, including the use of Terraform and managed identities. Caution points and considerations for migrating to the Azure Monitor Agent are mentioned. It is important to validate that the Azure Monitor Agent is collecting data as expected and to monitor the number of VM and VMSS that have sent heartbeats. The migration process is not simple and transparent, but it is well-documented, and it is recommended to start the migration as soon as possible.
#AzureMigration #MonitorAgentBenefits #LogAnalyticsRetirement #softcorpremium
How to fix performance issues using k6 and the Grafana LGTM Stack | Grafana Labs
The Grafana Labs ecosystem includes various projects for logging, metrics, traces, and load testing. This article explains how to use the Grafana LGTM Stack (Loki, Grafana, Tempo, and Mimir) along with k6 to run a load test and identify and fix performance bottlenecks. The article provides a step-by-step guide on writing a load test script, running the test, analyzing the results using Grafana dashboards, and making necessary adjustments to improve performance. The article also suggests further steps to explore different types of load tests and enhance observability systems.
#GrafanaLabs #loadtesting #observability #softcorpremium
Why are Prometheus queries hard? - Blog
This article discusses why Prometheus queries can be challenging and explains some of the complexities of the PromQL query language. It covers topics such as counters, instant and range vectors, rate functions, label sets, and the challenges of identifying the right metrics and ensuring query accuracy. The article introduces Autometrics, an open-source project that automates Prometheus queries, simplifying the process of instrumenting code and troubleshooting issues in production.
#PrometheusQueries #PromQL #Autometrics #softcorpremium
All About Logging In Kubernetes
The article discusses the importance of logging in Kubernetes and explores different types of logs in the Kubernetes system. It covers application-level, node-level, and cluster-level logging, as well as Kubernetes events and audit logs. The article also mentions logging libraries, agents, and platforms such as Grafana Loki and Elasticsearch. It concludes with the best practices for Kubernetes logging and offers references for further exploration.
#KubernetesLogging #LoggingBestPractices #LogManagement #softcorpremium
How to Use Log Management to Retrace Your Digital Footsteps
The article discusses the importance of log management in tracking and improving system performance. It explains the process of gathering and analyzing logs to identify issues and breaches. Log management tools save time and allow for easier identification of errors. It also highlights upcoming events and resources related to cybersecurity. Additionally, the article mentions the use of cookies to enhance website experience and personalize content. Users have the option to manage their cookie preferences for privacy reasons. Allowing targeting cookies will result in more targeted advertising.
#LogManagement #Cybersecurity #Cookies #softcorpremium
Calculating The ROI Of Your Data—And WHY It Matters
Data has become a crucial aspect of modern business, with organizations investing heavily in their data functions. However, there is a need to prove the return on investment (ROI) of these data programs. Data teams are now expected to demonstrate the value they bring to various departments, such as marketing, sales, and customer success. Proving ROI can be challenging, but it can be measured through metrics like operational efficiency, time saved, time to insights, and new revenue generated. The closer the data team's work is to real business outcomes, the easier it is to explain the ROI.
#DataROI #DataMetrics #BusinessOutcomes #softcorpremium