💡
Attention readers! We want to let you know that the summaries in this newsletter are generated using cutting-edge generative AI technology. However, we understand the importance of accuracy and quality content, so our team of expert editors manually reviews each summary before it's published. If you feel the quality of a particular summary does not meet your expectations, please leave a comment in the Member Discussion section below. We will rectify it as soon as humanly possible!
Kubernetes Logging : Using Kubectl Logs 📝☸️🐋 | by Vibhor Chinda | Google Cloud - Community | Aug, 2023 | Medium
In this article, the author discusses how to view Kubernetes pod logs using the kubectl command. They explain what kubectl is and how it is used to query and manage a Kubernetes cluster. They also explain the importance of logs for troubleshooting and monitoring the working of applications. The author provides various kubectl commands with examples, such as printing logs for a pod, printing logs for a container in a pod, and outputting logs to a file. They conclude by mentioning that this is just the beginning of exploring the Kubernetes ecosystem and encourage readers to follow them for more articles.
#KubernetesLogs #kubectlCommand #Troubleshooting #softcorpremium
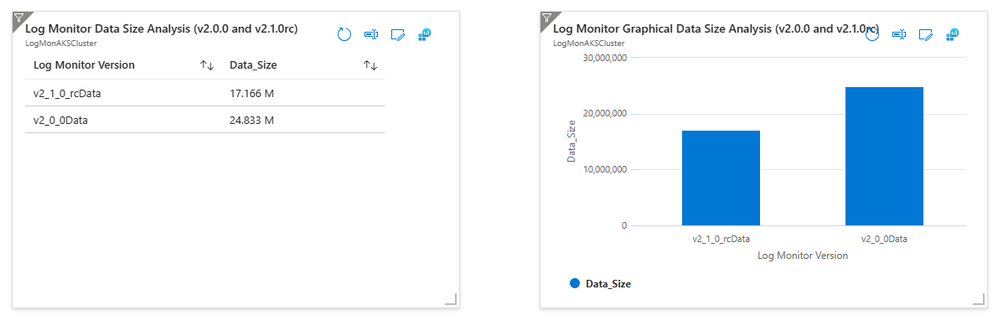
Announcing Log Monitor 2.0 Stable Release and 2.1 Release Candidate - Microsoft Community Hub
Log Monitor has released version 2.0 and version 2.1, offering customers the ability to expose Windows logs to the STDOUT pipeline. The new versions provide JSON log output for better interoperability and extensibility to log analysis tools. Log Monitor 2.1 also allows for custom log output in JSON, XML, or customized formats, resulting in a 31.23% reduction in log data size. The updates come with stability and quality improvements, as well as documentation updates. Users can easily customize the log format by configuring the Log Monitor settings. Advanced users can define their own custom JSON log format and enable sanitization of the output.
#LogMonitorUpdates #CustomLogFormats #LogAnalysisTools #softcorpremium
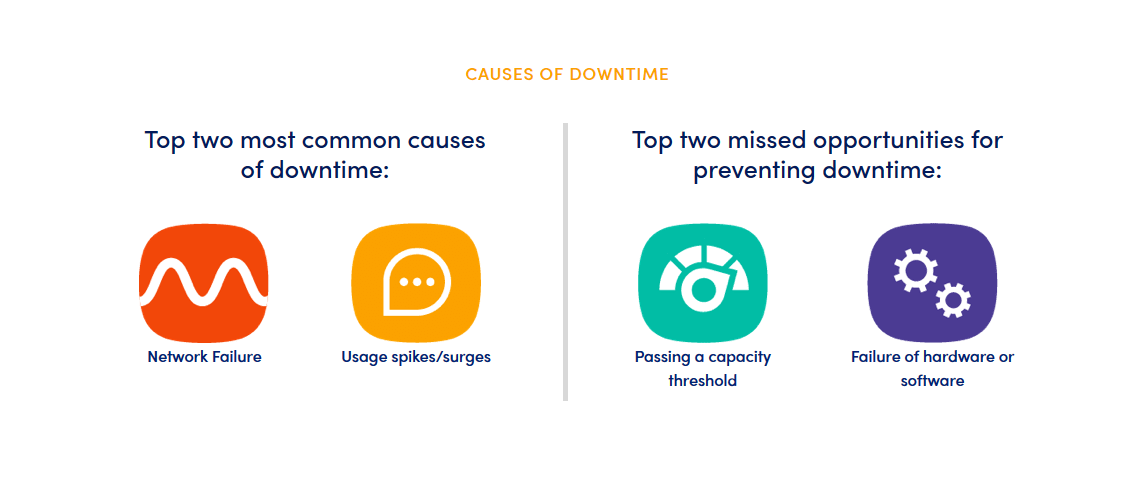
CloudTweaks | Preventing IT Outages and Downtime
IT outages and downtime continue to be a major challenge for organizations, impacting not only their bottom line but also society's reliance on technology. A recent survey found that 96% of IT decision-makers experienced at least one outage in the past three years, with 50% experiencing five or more outages. To prevent downtime, organizations can implement proactive maintenance, set up redundant systems, utilize monitoring tools, stay up-to-date with patches and updates, distribute network traffic, create a disaster recovery plan, educate employees, ensure vendor support and maintenance contracts, and regularly review and update IT policies and procedures. The survey also revealed that financial and technology organizations experienced the most frequent outages. Availability is crucial for businesses, with 80% of respondents ranking it above security and cost-effectiveness. Companies need comprehensive monitoring solutions that provide visibility into their IT infrastructure and can identify and address potential issues. By prioritizing availability and implementing effective monitoring, organizations can prevent downtime and optimize their operations.
#ITdowntime #proactivemaintenance #availability #softcorpremium
How we combined OpenTelemetry traces with Prometheus metrics to build a powerful alerting mechanism | Cloud Native Computing Foundation
The engineering team at Helios used open-source projects, specifically Prometheus and OpenTelemetry, to develop an alerting mechanism that allows users to set conditions and receive notifications for events in their system. They leveraged the power of the open-source community to find creative solutions to complex business problems and pass on tips and tricks to future developers. The company successfully converted trace data into Prometheus's data model to configure alerts triggered by spans, providing ultimate visibility into application performance and health. They used filters and aggregation logic to define the conditions for triggering an alert and integrated the alerting system with the OTel Collector. While there are challenges with using Prometheus alerts, the team found that relying on Prometheus saved them significant development time and allowed them to efficiently develop a complex alerting system. Overall, the team's experience demonstrates the benefits of using open-source collaboration to solve everyday challenges and improve user experience.
#OpenSourceCollaboration #AlertingSystemDevelopment #ApplicationPerformance #softcorpremium
How to Tackle Spiraling Observability Costs | Logz.io
Businesses are increasingly reliant on digital services, making software bugs and service interruptions unacceptable. Developers rely on telemetry data to quickly resolve issues, but this data increases computing costs. To reduce observability costs, engineering teams often sacrifice visibility into their systems. However, there are alternative strategies. Simplifying data collection and removing useless data can significantly reduce computing footprint. Data transformation and storage optimization can also cut costs. Logz.io offers solutions to optimize data and reduce costs without sacrificing visibility. Start by understanding your data and continuously optimize to reduce costs.
#ObservabilityOptimization #DataCostReduction #LogzioSolutions #softcorpremium
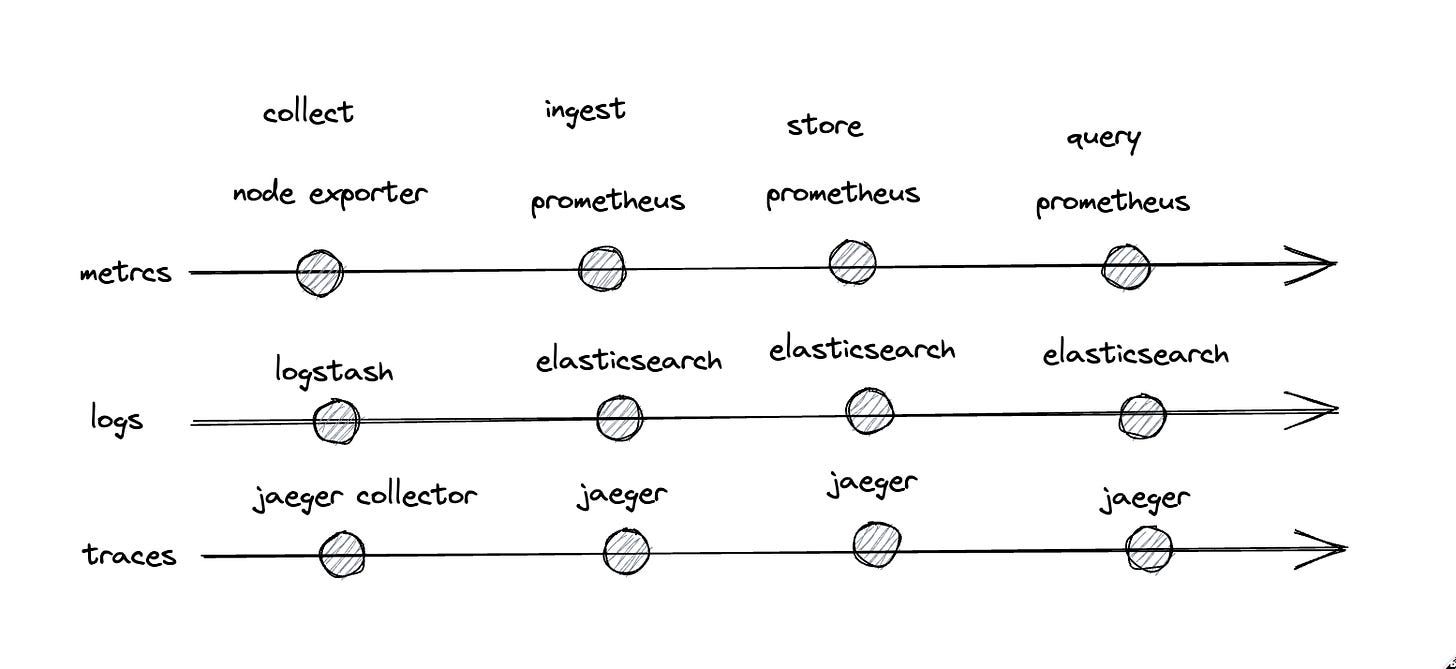
The Architecture of Modern Observability Platforms
Observability platforms are essential for organizations to understand the health of their applications and services. These platforms rely on the three pillars of modern observability: metrics, logs, and traces. However, the challenge lies in collecting, ingesting, storing, and querying massive amounts of observability data generated by thousands of services in Kubernetes clusters. The architecture of observability platforms plays a crucial role in addressing this challenge and can significantly impact costs. There are different types of architectures, including distinct and separate components for each pillar, unified collection and storage, and unified ingestion and querying. Each architecture has its advantages and vendors have implemented different solutions. The unification of the storage, ingestion, and querying layers can bring scalability and affordability to observability platforms, commodifying observability at scale. The ultimate goal is to translate observability data into insights and business outcomes.
#observabilityplatforms #modernobservability #observabilitydata #softcorpremium
APM Transaction Analysis | New Relic
New Relic has introduced APM Transaction Analysis, a dashboard that provides a unified and filterable view of transaction performance across an account. This feature is particularly helpful for analyzing the relative performance of multiple applications, setting up alert conditions, and exploring performance outliers. Users can install the quickstart to access pre-built resources like dashboards, instrumentation, and alerts. For assistance, users can visit the Support Center or the Explorers Hub.
#APMTransactionAnalysis #NewRelicFeatures #PerformanceAnalytics #softcorpremium
WordPress Full Stack | New Relic
New Relic has introduced a WordPress Full Stack monitoring quickstart that allows users to optimize the monitoring of WordPress metrics, plugins, logs, and performance analysis. WordPress is a popular CMS used for creating websites and web applications. The quickstart offers step-by-step documentation for instrumenting the monitoring process and provides a pre-built dashboard to monitor crucial performance metrics, database metrics, and error messages. It captures metrics such as plugin performance, user usage statistics, database metrics, browser metrics, transactions, and related error messages. Users can install the quickstart to improve their monitoring capabilities.
#WordPressMonitoring #NewRelicQuickstart #WebsitePerformance #softcorpremium
Postfix | New Relic
Postfix users can now monitor their email delivery and performance in real-time with the help of New Relic's infrastructure agent and Flex configuration. This monitoring includes tracking metrics such as message flows, queue sizes, per-day traffic summaries, per-hour traffic records, and server load. By properly monitoring Postfix, users can ensure the smooth operation and security of their mail server. The Postfix quickstart also provides preconfigured observability solutions, including informative dashboards and high-value alerts. Interested users can install the quickstart to improve their monitoring capabilities.
#emaildeliverymonitoring #postfixobservability #realtimemonitoring #softcorpremium
Amazon Elastic Transcoder | New Relic
Amazon Elastic Transcoder is a cloud-based media transcoding service that allows developers and businesses to convert media files into formats suitable for different devices. Users can now monitor Amazon Elastic Transcoder using New Relic by connecting AWS to the monitoring platform. This integration provides scalability, ease of use, and cost-effectiveness. Interested users can find more information and set up the integration through the provided documentation. New Relic offers pre-built resources like dashboards, instrumentation, and alerts to enhance monitoring capabilities. For further assistance, users can access the community forum or support center.
#cloudbasedmedia #mediaconversion #monitoringplatform #softcorpremium
Amazon SimpleWorkFlow | New Relic
Amazon SimpleWorkFlow can now be monitored using New Relic through an integration with Amazon Web Services (AWS). SimpleWorkFlow allows for easy coordination of work across distributed components, with tasks representing units of work performed by application components. By connecting AWS to New Relic, users can monitor SimpleWorkFlow and manage intertask dependencies, scheduling, and concurrency. The integration is easy to set up and offers pre-built resources like dashboards and alerts. Users can sign up for a free New Relic account or use their existing account to get started. Support is available through the New Relic community forum and support center.
#AmazonSimpleWorkFlow #AWSintegration #NewRelic #softcorpremium
Amazon CloudWatch Internet Monitor now supports Network Load Balancers as a resource type
Amazon Web Services (AWS) has announced that its CloudWatch Internet Monitor now supports Network Load Balancers (NLBs) as a resource type. This update allows users to gain visibility into internet performance and availability for user traffic directed to specific NLBs. The Internet Monitor also supports monitoring Amazon Virtual Private Clouds, Amazon CloudFront distributions, and Amazon WorkSpaces directories. With the new capabilities, users can quickly identify issues, affected locations, and network providers, and take action to improve the end users' network experience. The AWS Management Console provides a comprehensive global view of traffic patterns and health events, and users can access detailed information about events in different locations. Notifications are sent if an issue is caused by the AWS network, and measurements are published to Amazon CloudWatch Metrics and Amazon CloudWatch Logs. Health event notifications can also be set up through Amazon EventBridge.
#AWSNetworkPerformance #CloudWatchInternetMonitor #softcorpremium
Simplify managing Grafana Tempo instances in Kubernetes with the Tempo Operator | Grafana Labs
Andreas Gerstmayr, a Software Engineer at Red Hat, is working on simplifying the deployment and operations of a modern distributed tracing stack using Tempo and OpenTelemetry on OpenShift. The new Tempo operator, developed by Gerstmayr's team, simplifies deploying a Tempo stack on Kubernetes by creating and managing all required objects, exposing metrics, and supporting upgrades. The operator dynamically reacts to changes and performs actions based on the current state, making it stand out from other deployment methods. The operator can be installed via OperatorHub or by applying Kubernetes manifests directly to the cluster. It also supports various object storages like MinIO, Amazon S3, Azure Storage, and Google Cloud Storage. The Tempo operator can be used to configure a Tempo cluster, and traces can be sent to Tempo by pointing applications or OpenTelemetry collectors to the specified endpoint. The operator also supports features such as resource limits, multitenancy, Jaeger UI deployment, metrics exposure, and mTLS security. The Tempo operator aims to make it easier for system administrators and SREs to run Tempo clusters in production by delegating operational tasks and plans to add more self-healing functionality in the future.
#TempoOperator #DistributedTracingStack #OpenTelemetry #softcorpremium
Sendmail | New Relic
New Relic has introduced a new feature called Sendmail Monitor, which allows users to monitor their Sendmail infrastructure and receive real-time insights into email delivery and performance. This includes monitoring message status, mail logs, errors, warnings, and sender/recipient details. Effective Sendmail performance monitoring ensures smooth operation, efficient message processing, and timely delivery of emails. Key factors to consider when assessing a Sendmail dashboard include backlog analysis, delivery success rate, error tracking, and message processing. The Sendmail quickstart provides preconfigured observability solutions, including informative dashboards and high-value alerts. Users can install this quickstart to enhance their monitoring capabilities. New Relic offers support and resources like dashboards, instrumentation, and alerts to assist users in optimizing their Sendmail environment.
#SendmailMonitoring #EmailPerformance #ObservabilitySolutions #softcorpremium
New in Grafana 10: Grafana Scenes for building dynamic dashboarding experiences | Grafana Labs
Grafana has released its latest major update, Grafana 10, which includes a new frontend library called Grafana Scenes. This library allows developers to create dashboard-like experiences within their Grafana application plugins, offering features like querying and transformations, dynamic panel rendering, and customizable time ranges. Grafana Scenes emphasizes extensibility, enabling development teams to create highly dynamic and customizable dashboarding experiences. The goal is to make it easier for developers to create the functionalities they want without having to write everything from scratch. Grafana Scenes is currently available in public preview and developers can access starter templates and examples to get started. The long-term plan is to integrate Scenes into the core dashboarding experience and explore standalone runtime options.
#GrafanaScenes #DashboardingExperience #DeveloperTools #softcorpremium
Kelemetry: global tracing for Kubernetes control plane | Cloud Native Computing Foundation
ByteDance has developed Kelemetry, a tracing system for the Kubernetes control plane, to improve observability, understanding, and troubleshooting of the Kubernetes system. Kelemetry focuses on the Kubernetes API and provides a comprehensive view of the system's performance and dependencies. It creates spans for objects and treats each event as a child span, allowing for better understanding of user-facing behavior. Kelemetry collects and connects signals from different components to provide real-time monitoring and troubleshooting capabilities for large-scale clusters. It uses apiserver audit logs as a main data source and simplifies the deployment process by providing an audit webhook server. Kelemetry also tracks changes made to Kubernetes objects and helps identify conflicts between controllers. It offers features like grouping audit logs, multi-leader election mechanism, and span modification after completion. Kelemetry has introduced new features to improve the auditing and tracing processes, including a custom transformation pipeline and a storage plugin. It allows users to select a transformation pipeline and easily access and view specific traces. Kelemetry supports multi-cluster monitoring and plans to adopt custom trace sources in the future. The system enables batch analytics and has various use cases, including investigating abnormal behavior in a replicaset controller. Kelemetry has helped identify issues such as inconsistent pod cache and performance problems with informers, providing a more efficient and effective debugging process.
#Kelemetry #KubernetesObservability #TracingSystem #softcorpremium
Streamlining observability: the journey towards query language standardization | Cloud Native Computing Foundation
At KubeCon Europe 2023, a discussion about standardizing a query language for observability highlighted the need for a unified approach to querying data across different signals. The multitude of query languages currently in use creates challenges and hinders productivity for DevOps professionals. To address this issue, a new working group under the Cloud Native Computing Foundation (CNCF) has been formed, spearheaded by eBay and Netflix. The group aims to develop a standardized query language for observability, enabling consistent experiences across logs, metrics, and traces. The adoption of a unified language would also promote interoperability between different observability providers and simplify collaboration. The Observability Query Standard Working Group is currently seeking contributions and input from interested individuals to shape the future of observability query standards.
#observabilitystandards #querylanguage #devops #softcorpremium
Application Observability: A critical priority to optimize application performance and accelerate innovation - Application Performance Monitoring Blog | AppDynamics
A new report highlights the challenges faced by technologists in implementing cloud native technologies alongside existing on-premises applications and infrastructure. The rapid adoption of these technologies is generating overwhelming amounts of data that traditional monitoring tools are unable to handle, making manual monitoring impossible. This complexity is also leading to an expansion of attack surfaces and increased vulnerability to cybersecurity threats. As a result, IT teams are struggling to troubleshoot issues before they impact end-user experience, risking disruption, downtime, and loss of customers and revenue. The complexity is also causing silos and ineffective collaboration, leading to an IT talent exodus. To address these challenges, organizations need to implement application observability, which provides a single source of truth for all IT teams. This unified observability enables deeper insight, improved productivity, and better collaboration. It also allows IT leaders to correlate IT performance data with business transactions to track the impact of innovation initiatives. Application observability is now a strategic priority for organizations, and Cisco AppDynamics is a leading provider of application observability and performance monitoring technology. They help organizations deliver exceptional user experiences by centralizing and correlating data into contextualized insights. IT leaders must act quickly to implement the right observability solution for their organization.
#CloudNativeChallenges #ApplicationObservability #ITPerformanceMonitoring #softcorpremium
Ingest OpenTelemetry metrics with Prometheus natively | Last9
Prometheus, a popular metrics monitoring tool, has added native support for ingesting OpenTelemetry metrics. OpenTelemetry is a project that allows for metrics, logs, and traces monitoring. Previously, there was a disparity between the metric naming conventions of OpenTelemetry and Prometheus, but a new module in the otel-collector-contrib package now facilitates the conversion of OpenTelemetry metrics into Prometheus-compliant metrics. Additionally, a recent pull request by a Prometheus maintainer and Product Manager at Grafana Labs has been merged, adding support for ingesting OpenTelemetry metrics using an OTLP-compatible ingestion endpoint. This change is still experimental, and documentation updates are expected before the final release. The integration of OpenTelemetry metrics in Prometheus provides users with a combined pull-based model and ensures compatibility no matter how the metrics are generated.
#PrometheusOpenTelemetryIntegration #MetricsMonitoring #softcorpremium
Continuous Observability: Shedding Light on CI/CD Pipelines | Logz.io
The importance of quality observability in continuous integration/continuous delivery (CI/CD) pipelines is highlighted in a recent discussion with Oleg Nenashev, a core maintainer and board member in the Jenkins project. The conversation focused on the expanding toolset of CI/CD observability, the need for standardization, and the proposal to extend OpenTelemetry to support CI/CD observability use cases. The Continuous Delivery Foundation (CDF) and Cloud Native Computing Foundation (CNCF) host various open-source projects and provide a platform for collaboration. The CDEvents specification under the CDF aims to standardize continuous delivery events, enabling seamless communication between CI/CD tools. Implementing CDEvents offers benefits such as aggregated data, simplified debugging, and integration with other systems. OpenTelemetry, an observability framework, is being enhanced to cover CI/CD observability, with a proposal for semantic conventions within the specification. Developers and practitioners are encouraged to contribute ideas and participate in discussions to shape the future of CI/CD observability.
#CI_CDobservability #CDFevents #OpenTelemetry #softcorpremium