Leveraging partner solutions for monitoring enterprise workloads on Azure
Azure has its own native observability stack in the form of Azure Monitor, allowing customers to detect and diagnose issues as they occur.

Azure has its own native observability stack in the form of Azure Monitor, according to the official documentation some of the things that you can do with Azure Monitor include:
- Detect and diagnose issues across applications and dependencies with Application Insights.
- Correlate infrastructure issues with VM insights and Container insights.
- Drill into your monitoring data with Log Analytics for troubleshooting and deep diagnostics.
- Support operations at scale with smart alerts and automated actions.
- Create visualizations with Azure dashboards and workbooks.
- Collect data from monitored resources using Azure Monitor Metrics.
In this post I want to focus on how we can leverage partner monitoring solutions in a similar way that we leverage Azure Monitor today. There are multiple solutions available to organizations for example Datadog & Dynatrace - in this post I will be focusing on the Datadog solution.
Typically, when organizations look at monitoring their solutions, they need to consider the following basics:
- Enable monitoring for all components of your solution (Application, Infrastructure, Identity & Access Control).
- Build out discrete monitoring infrastructure by environment i.e. Development and Production.
- Leverage monitoring insights throughout development and deployment of their solution to ensure consistent quality.
- Configure actionable Alerts & Dashboards.
I looked at how we can leverage Datadog in our environment to achieve the above, I see two basic strategies for enabling the solution:
- If you are leveraging the Datadog US3 site you can deploy Azure Partner Solution for Datadog solution or,
- Manual Configuration, for all other Datadog sites including Highly regulated organizations or for organizations with data sovereignty concerns.
The basic steps for manual configuration are as follows:
- Configure scraping of Azure Metrics.
- Install Datadog Agent for system & application metric collection (Better resolution, custom metrics etc).
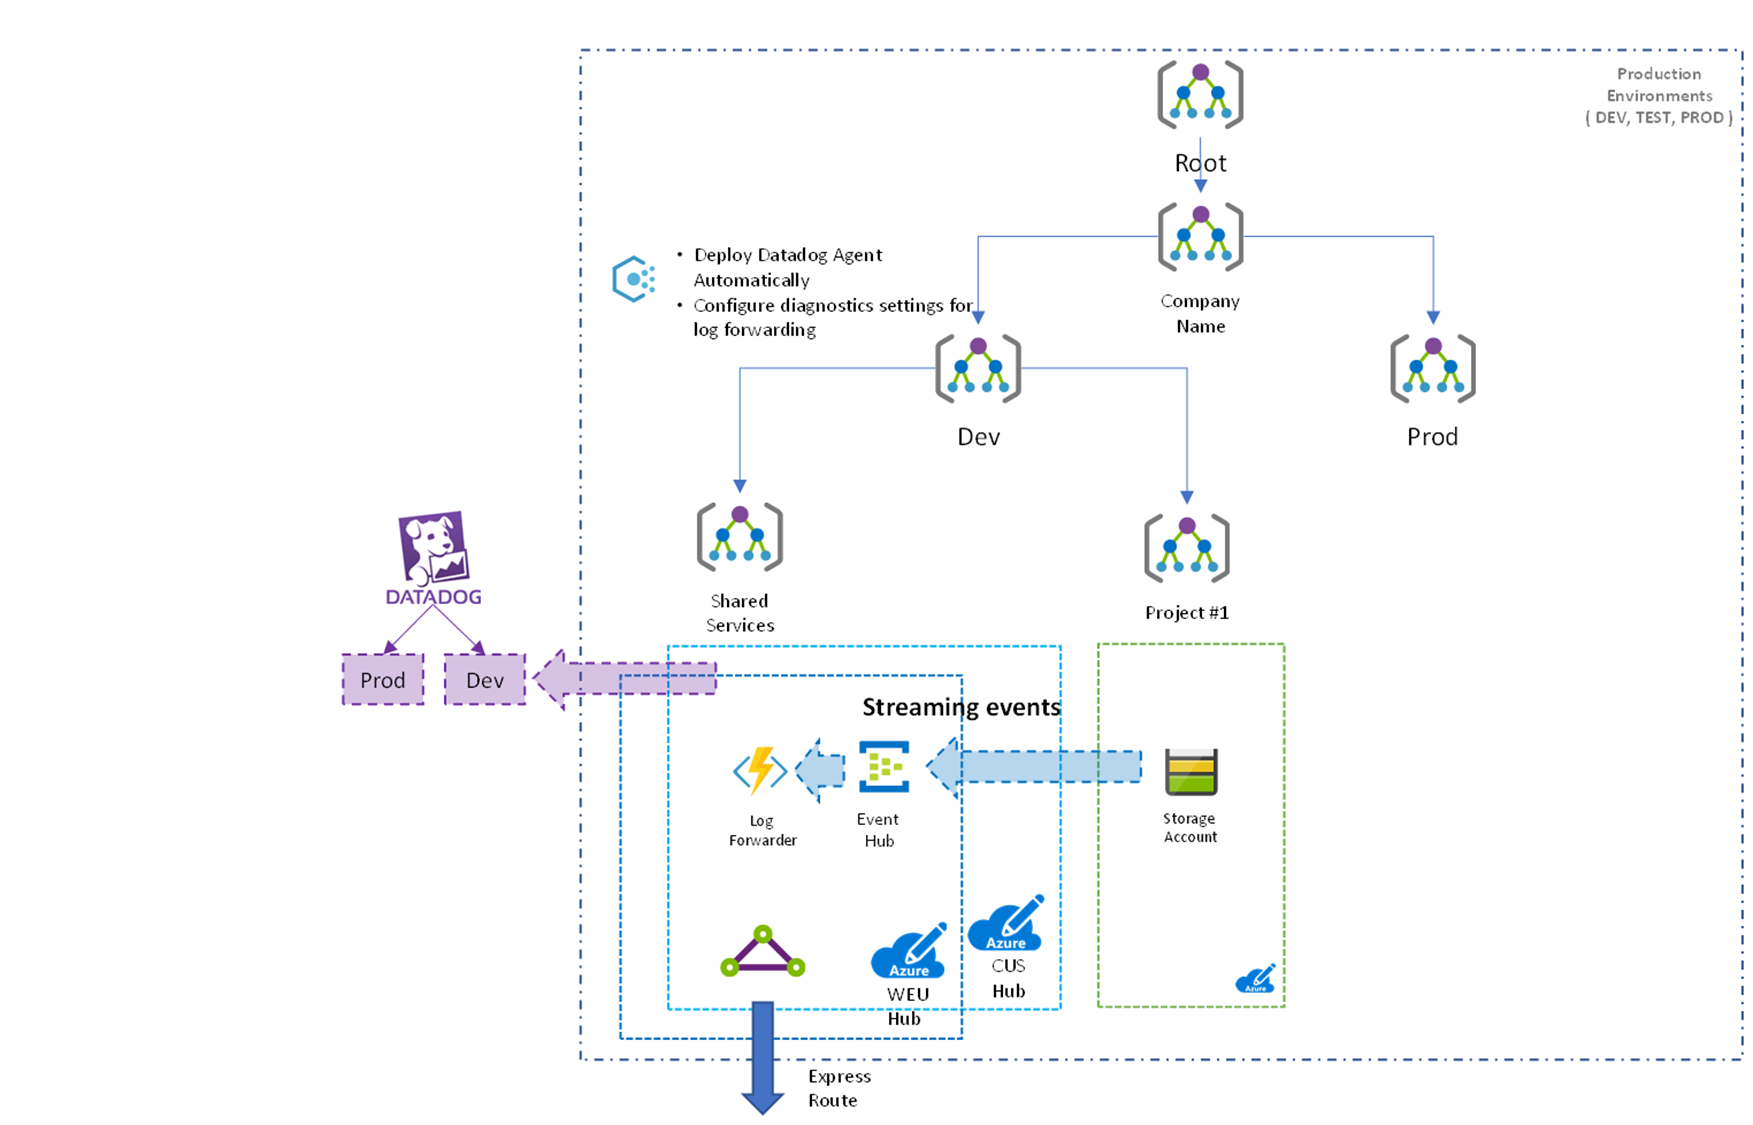
- Deploy Regional Azure Platform Log Forwarders for streaming events from Azure resources to Datadog.
- Configure resources to send logs via diagnostic settings.
Once you have configured your environment for Datadog whats next? Well typically organizations want to enforce their monitoring requirements via the platforms governance controls - i.e. "Observing by default".
Enforcing "Observe by Default"
To configure our scenario, we need to ensure the following steps are completed beforehand:
- Configure scraping of Azure Metrics.
- Deploy Regional Azure Platform Log Forwarders for streaming events from Azure resources to Datadog.
I won't be going into great deal of detail, but the key to enforcing any sort of compliance requirement on Azure is leveraging the following Azure Governance Controls:
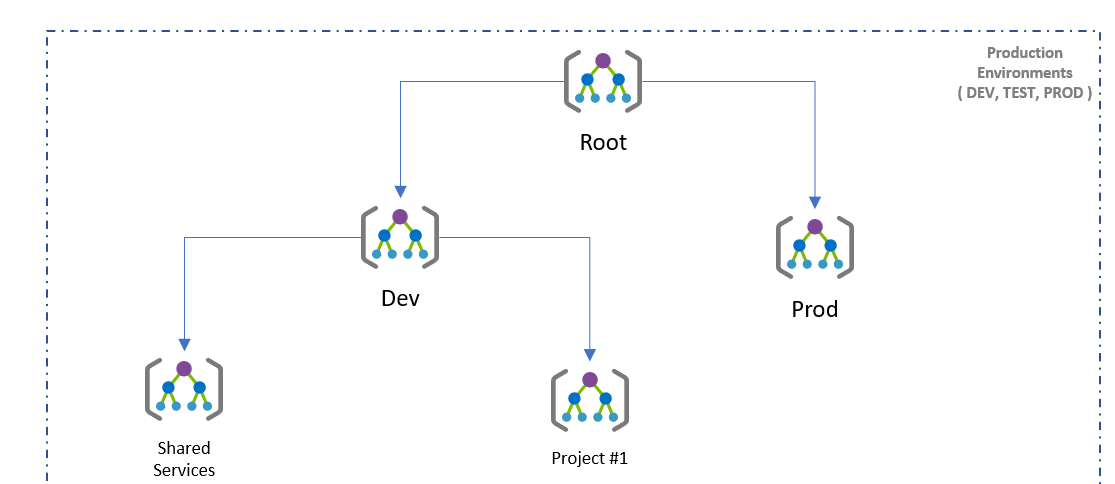
A basic management group hierarchy may look something like the following:

This allows the organization to apply governance controls per environment and/or per project. If you wish to read more about Microsoft's guidance around architecture and governance, look at the Enterprise Scale landing zone documentation.
When we talk about Azure Monitor, some common Azure policies which are applied in this hierarchy to ensure compliant monitoring are:
- Deploy the Monitoring Agent.
- Deploy Diagnostic Settings for each resource type which configures streaming events to Log Analytics Workspace.
These policies typically leverage the Deploy if Not Exists Pattern to ensure applicable changes are made for non-compliant resources. If we apply the same patterns for our Datadog scenario, we need to write a custom Azure Policy which will enforce installation of the Datadog agents for Windows and Linux.
Deploy Datadog VM Extension for Linux VMs Sample.
{
    "displayName": "Deploy Datadog VM Extension for Linux VMs.",
    "mode": "Indexed",
    "description": "This policy deploys Datadog VM Extensions on Linux VMs in specific regions, and connects to the selected Datadog site.",
    "metadata": {
        "category": "Compute"
    },
    "parameters": {
        "datadogApiKey": {
            "type": "string",
            "metadata": {
                "displayName": "Datadog Api Key",
                "description": "Datadog API Key from https://app.datadoghq.com/account/settings#api."
            }
        },
        "datadogSite": {
            "type": "string",
            "metadata": {
                "displayName": "Datadog Site",
                "description": "Select Datadog site from dropdown list",
                "assignPermissions": true
            },
            "allowedValues": [
                "datadoghq.com",
                "datadoghq.eu",
                "us3.datadoghq.com",
                "ddog-gov.com"
            ]
        },
        "effect": {
            "type": "string",
            "metadata": {
                "displayName": "Effects",
                "description": "Enable or disable the execution of the Policy."
            },
            "allowedValues": [
                "DeployIfNotExists",
                "Disabled"
            ],
            "defaultValue": "DeployIfNotExists"
        },
        "targetRegions": {
            "type": "array",
            "metadata": {
                "displayName": "Target Regions",
                "description": "This dictates which regions should be connected to this Datadog site.",
                "strongType": "location"
            }
        }
    },
    "policyRule": {
        "if": {
            "allOf": [
                {
                    "field": "type",
                    "equals": "Microsoft.Compute/virtualMachines"
                },
                {
                    "field": "Microsoft.Compute/virtualMachines/storageProfile.osDisk.osType",
                    "equals": "Linux"
                },
                {
                    "field": "location",
                    "In": "[parameters('targetRegions')]"
                }
            ]
        },
        "then": {
            "effect": "[parameters('effect')]",
            "details": {
                "type": "Microsoft.Compute/virtualMachines/extensions",
                "existenceCondition": {
                    "allOf": [
                        {
                            "field": "Microsoft.Compute/virtualMachines/extensions/type",
                            "equals": "DatadogLinuxAgent"
                        },
                        {
                            "field": "Microsoft.Compute/virtualMachines/extensions/publisher",
                            "equals": "Datadog.Agent"
                        }
                    ]
                },
                "roleDefinitionIds": [
                    "/providers/Microsoft.Authorization/roleDefinitions/9980e02c-c2be-4d73-94e8-173b1dc7cf3c"
                ],
                "deployment": {
                    "properties": {
                        "mode": "incremental",
                        "template": {
                            "$schema": "http://schema.management.azure.com/schemas/2015-01-01/deploymentTemplate.json#",
                            "contentVersion": "1.0.0.0",
                            "parameters": {
                                "vmName": {
                                    "type": "string"
                                },
                                "location": {
                                    "type": "string"
                                },
                                "api_key": {
                                    "type": "secureString"
                                },
                                "site": {
                                    "type": "string"
                                }
                            },
                            "resources": [
                                {
                                    "name": "[concat(parameters('vmName'),'/DatadogAgent')]",
                                    "type": "Microsoft.Compute/virtualMachines/extensions",
                                    "location": "[parameters('location')]",
                                    "apiVersion": "2021-03-01",
                                    "properties": {
                                        "publisher": "Datadog.Agent",
                                        "type": "DatadogLinuxAgent",
                                        "typeHandlerVersion": "1.1",
                                        "autoUpgradeMinorVersion":	true,
                                        "settings": {
                                            "site" : "[parameters('site')]"
                                        },
                                        "protectedSettings": {
                                            "api_key": "[parameters('api_key')]"
                                        }
                                    }
                                }
                            ],
                            "outputs": {
                                "policy": {
                                    "type": "string",
                                    "value": "[concat('Enabled Datadog Agent for Linux VM', ': ', parameters('vmName'))]"
                                }
                            }
                        },
                        "parameters": {
                            "vmName": {
                                "value": "[field('name')]"
                            },
                            "location": {
                                "value": "[field('location')]"
                            },
                            "api_key": {
                                "value": "[parameters('datadogApiKey')]"
                            },
                            "site": {
                                "value": "[parameters('datadogSite')]"
                            }
                        }
                    }
                }
            }
        }
    }
}
The community have also contributed a number of custom Azure Policies which can be extremely useful for organizations. A second type of policy which we will need to assign is one which will Deploy Diagnostic Settings for each supported resource type which configures streaming events to EventHub.
If we put these pieces together we end up with something like the following:

Hope you enjoyed this brief look at how we can effectively leverage some of the partner monitoring solutions which are available on Azure!